Course Intermediate 15233
Course Introduction:This public welfare live broadcast uses Vue scaffolding to complete the single-page display of China's epidemic and global epidemic data~ The project structure is carried out using the current trend of completely separating the front and back ends. The way to display China's epidemic data is to make a China epidemic map, and the way to display global epidemic data is to make a column chart. The technical hot spots involved are as follows: 1. echarts map configuration, complex column chart configuration; 2. axios cross-domain request cache data interface; 3. tp redis caches third-party interface data and other contents;

Course Intermediate 11429
Course Introduction:"Self-study IT Network Linux Load Balancing Video Tutorial" mainly implements Linux load balancing by performing script operations on web, lvs and Linux under nagin.

Course Advanced 17719
Course Introduction:"Shangxuetang MySQL Video Tutorial" introduces you to the process from installing to using the MySQL database, and introduces the specific operations of each link in detail.
Creating dynamic 'andWhere' queries in TypeORM
2023-08-03 14:25:08 0 1 536
thinkphp5.1 classification filtering ideas
2018-12-21 15:42:28 0 1 1195
How to do multi-condition filtering in PHP mall?
How to do multi-condition filtering in PHP mall?
2018-03-06 13:46:15 0 2 1469
javascript - Safari dynamically assigning values to select does not take effect
2017-06-12 09:27:42 0 2 889
Reactive modal sliding animation
2023-08-30 22:49:29 0 1 586

Course Introduction:Dynamic filtering and clustering optimization of Vue statistical charts In the field of data visualization, statistical charts are a common way to present data. Using the Vue framework to develop statistical charts with strong interactivity, dynamic filtering and clustering optimization can provide better user experience and data analysis capabilities. This article will introduce how to use the Vue framework combined with common statistical chart plug-ins (such as Echarts) to implement dynamic filtering and clustering optimization functions. In order to better explain the problem, we will take the histogram as an example and attach the corresponding code example.
2023-08-25 comment 0 1604

Course Introduction:RiSearchPHP's techniques for implementing dynamic filtering and aggregated search require specific code examples. Introduction: With the development of the Internet and the increase in data scale, the functional requirements of search engines are becoming more and more diverse. Users are no longer satisfied with simple keyword searches, but want to be able to filter and aggregate searches according to their own needs. RiSearch is a high-performance full-text search engine based on PHP that can meet the needs of dynamic filtering and aggregated search. This article will introduce how to use RiSearch to achieve
2023-10-03 comment 0 1532

Course Introduction:How to use Vue and Excel to implement dynamic filtering and sorting of data 1. Introduction Excel table is a powerful data processing tool, and Vue is a popular JavaScript framework used to build user interfaces. In actual development, we may need to use Vue to dynamically filter and sort data in Excel tables. This article will introduce you to how to use Vue and Excel to dynamically filter and sort data. 2. Technical preparation Before starting, make sure you have installed the following software
2023-07-21 comment 0 1697

Course Introduction:How to implement dynamic filtering and sorting of statistical charts under the Vue framework Introduction: In modern data visualization applications, it is often necessary to dynamically filter and sort data according to user needs, and present the results to users in the form of statistical charts. The Vue framework provides us with a flexible and efficient way to implement this function. This article will introduce how to use the Vue framework to implement dynamic filtering and sorting statistical charts, and provide code examples. 1. Data preparation First, we need to prepare relevant data for display in statistical charts. here
2023-08-19 comment 0 1557

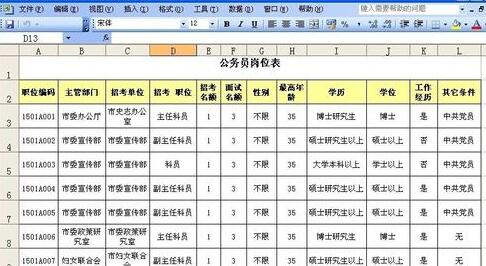
Course Introduction:Open a document you want to filter. Select the content you want to filter, click the [Filter] command in the [Data] menu, and then click the [Auto Filter] submenu. After clicking AutoFilter, a drop-down button will appear next to each field in the worksheet. Select the drop-down button next to the field name you want to set, and select the conditions you want to filter in the box. For example: Set the condition for [Degree] as Ph.D. At this time, only the data column of [Doctor] is displayed in the worksheet. If you need to cancel automatic filtering, just select them all, click [Data] - [Filter] - [Automatic Filter], and all the data will be restored.
2024-04-17 comment 0 774