Found a total of 10000 related content

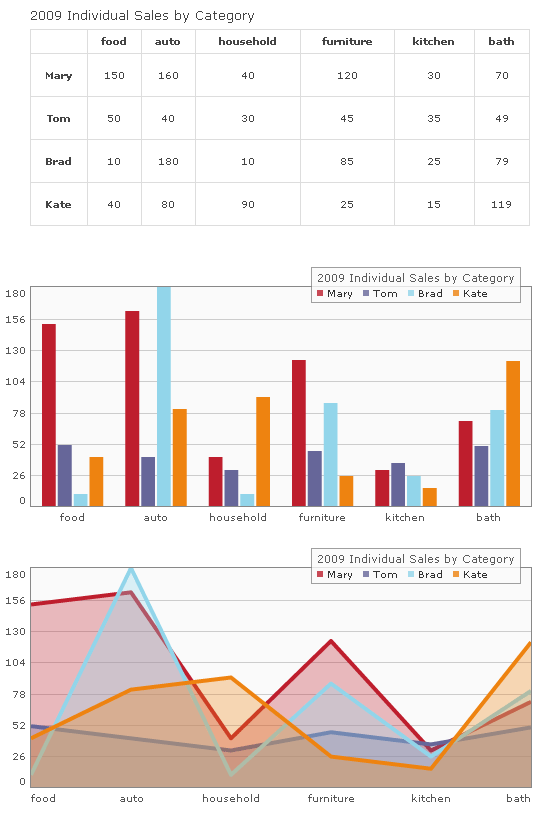
Development and debugging of Vue statistical chart plug-in
Article Introduction:Introduction to the development and debugging of Vue statistical chart plug-in: In modern web development, statistical charts are very common components. They can be used to visualize data, making it easier to understand and analyze. As a popular front-end framework, Vue provides many powerful tools and libraries, including plug-ins for developing and debugging statistical charts. This article will introduce how to use Vue to develop and debug a simple statistical chart plug-in, and provide some code examples. Preparation First, we need a Vue project. Can use Vue
2023-08-17
comment 0
1747

Loading and performance optimization of Vue statistical chart plug-in
Article Introduction:Summary of loading and performance optimization of Vue statistical chart plug-in: Statistical charts are one of the common functions in web applications. The Vue framework provides many excellent plug-ins for rendering statistical charts. This article will introduce how to load and optimize the performance of the Vue statistical chart plug-in, and give some sample code. Introduction: With the popularity of Web applications, data visualization has become one of the focuses of attention in all walks of life. As an important form of data visualization, statistical charts can help users better understand and analyze data. In the Vue framework, there are many excellent
2023-08-18
comment 0
959
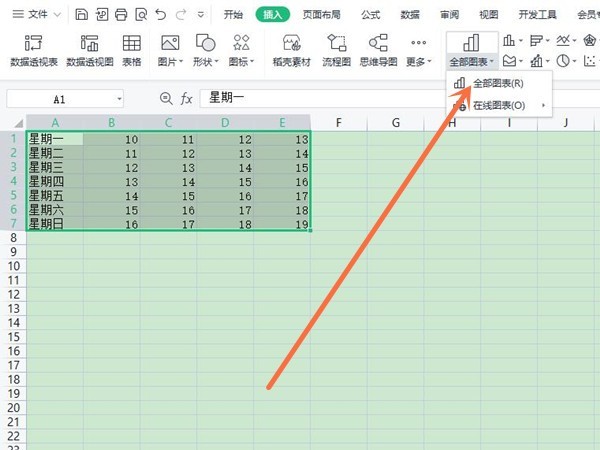

How to use Vue statistical chart plug-in and examples
Article Introduction:How to use the Vue statistical chart plug-in and examples Introduction: When developing web applications, statistical charts are very useful data visualization tools. Vue.js is a popular JavaScript framework that provides many convenient plugins and tools for creating interactive statistical charts. This article will introduce how to use the statistical chart plug-in using Vue.js and provide some code examples. 1. Install the Vue statistical chart plug-in. Before starting, we need to make sure that Vue.js has been installed. Then we can make
2023-08-25
comment 0
1450

How to insert a chart in word
Article Introduction:Sometimes in order to display the data more intuitively, we need to use charts to display it. But when it comes to charts, many people think that they can only be operated on Excel. In fact, this is not the case. Word can also directly insert charts. How to do it? Just take a look and you'll find out. 1. First we open a word document. 2. Next we find the "Chart" tool button in the "Insert" menu and click it. 3. Click the "Chart" button and select a suitable chart. Here we can select a chart type at will and click "OK". 4. After selecting the chart, the system will automatically open the excel chart, and inside The data has been entered, we just need to change the data. If you have already prepared the form here,
2024-03-20
comment 0
681

Calling Baidu map plug-in in Vue
Article Introduction:This time I will bring you the things to pay attention to when calling the Baidu map plug-in in Vue. The following is a practical case, let’s take a look.
2018-05-08
comment 0
3154

Selection and comparison of Vue statistical chart plug-ins
Article Introduction:Selection and comparison of Vue statistical chart plug-ins With the increasing demand for data visualization, statistical chart plug-ins have become an indispensable part of development. For projects developed using the Vue framework, it is very important to choose a suitable Vue statistical chart plug-in. This article will introduce some common Vue statistical chart plug-ins and compare them to help developers choose the appropriate plug-in. vue-chartjsvue-chartjs is a Vue plug-in based on Chart.js, which provides a simple
2023-08-17
comment 0
1192

Access入门教程 14.1 如何插入图表
Article Introduction:将数据用 图表 方式显示很简单,在Access2000中,不管在窗体、报表还是在页中都可以 插入 图表 。这里我们讲述在窗体上 插入 一个 图表 的过程,而在报表和页中 插入 图表 是完全相同的, 我们先打开一个数据库,这里以天智公司1999年各分公司销售情况数据库
2016-06-07
comment 0
2290
jQuery plug-in to realize large picture full screen picture album_jquery
Article Introduction:This article mainly introduces the methods and examples of the jQuery plug-in to implement large-picture full-screen photo albums. It is implemented based on the jQuery plug-in jQuery.album.js. The effect is very good. I recommend it to everyone. I hope you will like it.
2016-05-16
comment 0
1257

How to insert a WPS table into a WPS document How to insert a WPS table into a WPS document
Article Introduction:WPS is one of the commonly used office software. Do you know how to insert a WPS table into a WPS document? The following article brings you the method of inserting WPS tables into WPS documents. Interested users can take a look below. How to insert a WPS table into a WPS document? How to insert a WPS table into a WPS document Open WPS and create a new wps document; in the wps document, click "Insert"; in the insert function bar, click "Attachment"; on the computer, click on the wps table to be inserted and click "Open"; as shown in the picture: the wps table has been inserted into the wps document. Double-click to open the inserted wps table.
2024-08-06
comment 0
591

Selection and comparison of jQuery focus map plug-ins
Article Introduction:Selection and comparison of jQuery focus map plug-ins In web development, focus map carousels are a common requirement, which can help websites present more dynamic and attractive page effects. As a popular JavaScript library, jQuery provides many excellent focus map plug-ins. Developers can choose the appropriate plug-in according to their own needs to achieve the focus map carousel effect. This article will compare several commonly used jQuery focus map plug-ins and provide specific code examples. OwlCarouselOw
2024-02-27
comment 0
1123
The operation process of inserting charts into Tencent documents
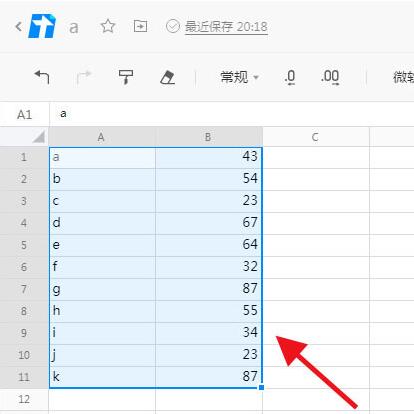
Article Introduction:1. Select the content data of the chart to be added in the table. 2. Click Insert-Chart above. 3. Select the chart type to be inserted on the right. 4. Click directly on the operating points around the chart to adjust the size. 5. The display parameters of each chart content are different and can be directly clicked and dragged. 6. Right-click the chart to delete it directly.
2024-04-08
comment 0
1157
表单只读小插件
Article Introduction:表单只读小插件
2016-05-19
comment 0
832
jquery plug-in jquery.nicescroll implements image drag and drop displacement
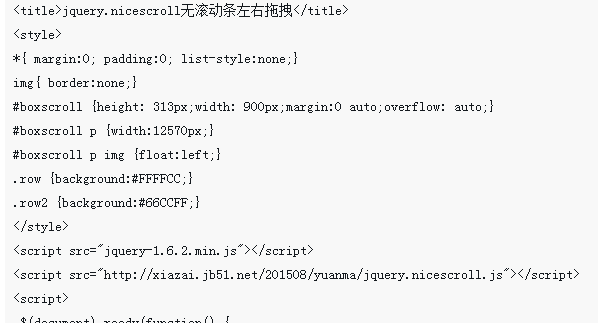
Article Introduction:This time I bring you the jquery plug-in jquery.nicescroll to implement image dragging and displacement. What are the precautions for the jquery plug-in jquery.nicescroll to implement image dragging and displacement. The following is a practical case, let's take a look.
2018-04-25
comment 0
1458

How to implement image carousel function through WordPress plugin
Article Introduction:How to implement image carousel function through WordPress plug-in In today’s website design, image carousel function has become a common requirement. It can make the website more attractive and can display multiple pictures to achieve better publicity effect. In WordPress, we can implement the image carousel function by installing plug-ins. This article will introduce a common plug-in and provide code samples for reference. 1. Plug-in introduction In the WordPress plug-in library, there are many image carousel plug-ins to choose from, one of which is often
2023-09-06
comment 0
1876

How to create a column chart in Excel, how to generate a column chart in Excel
Article Introduction:Everyone will have various problems when using Excel. Some friends come to this site to ask me how to make a column chart in Excel, an office software. In order to help everyone, I collected relevant information online and finally found it. Learn how to generate a histogram from an excel table. The details are in the article below. If you need it, please come to this site to take a look. How to make a column chart in the office software Excel? The specific steps are as follows: 1. Take the table data in the figure below as an example to explain how to make a column chart in Excel; 2. Select the table data and click [Insert] - [Table] 】, convert the table into a chart; 3. Then click [Insert]-[Chart]-[Two-dimensional Column Chart]; 4. Now you can see
2024-01-07
comment 0
2538

How to use the empire cms map plug-in
Article Introduction:The Empire CMS map plug-in is an extension that automatically generates website maps to facilitate search engine inclusion and user browsing. After installation, you can configure the generation frequency and file location through the background, and generate the sitemap.xml file with one click. After submitting the map to Webmaster Tools, search engines will regularly crawl and update map data to improve website inclusion.
2024-04-17
comment 0
676

Detailed method of inserting pictures into tables in wps
Article Introduction:1. First we open wps. 2. Click the plus sign in the lower right corner. 3. Click New Form. 4. Click Create New Blank. 5. Click the file box in the lower left corner. 6. Click Insert. 7. Select a picture. 8. Select the picture you want to insert and click OK.
2024-03-28
comment 0
548
