Home > Article > Web Front-end > What debugging tools are used for web front-end?
Debugging tools available for the front end: 1. Development tools in web browsers, such as using the console statement "console.log()", or using the debugger statement to pause code execution; 2. Postman, debugging interface tool, Can adjust requests, analyze responses and debug problems; 3. CSS Lint, a tool used to find problems in CSS code; 4. Sentry, which can be used to monitor errors and extract all the information needed to perform appropriate post-action actions; 5. JSHint, a JS code analysis and detection tool.

The operating environment of this tutorial: Windows 7 system, Dell G3 computer.
If you are engaged in front-end development, you should understand that debugging code is still very difficult. Especially with JavaScript, a small bug can sometimes take hours to debug. With different browsers, operating systems and devices, errors are inevitable.
This article mainly lists some debugging tools, you can choose according to the situation.
1. Development tools in the web browser
Any modern web browser is equipped with powerful tools to debug applications . For example, use the console statement console.log(), use the alert() pop-up window, and use the debugger statement to pause code execution, which are very helpful for our debugging.
We can also use the network inspector or CSS style inspector to make debugging easier and smoother.
Any modern web browser comes with powerful tools to help debug your application. It can be as simple as a console statement using console.log(), a popup window using alert(), or even using a debugger statement to pause code execution. These tools are very helpful for our debugging tasks, especially debugger statements.
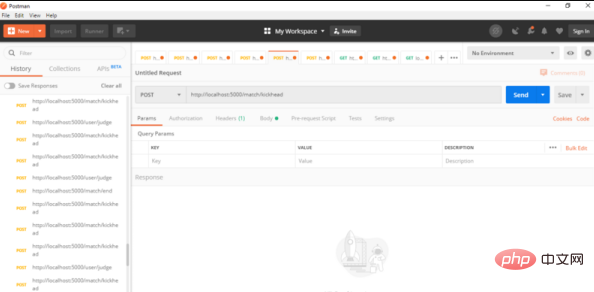
2, Postman
Address: https://www.postman.com/
Almost all front-end applications Both send and receive JSON responses and requests. Applications can do a lot of things by requesting the API, such as authentication, user data transfer, and even simple things like getting the current weather for their location.
Postman is one of the best tools for debugging interfaces. It works on MacOS, Windows and Linux systems and can quickly and easily send REST, SOAP and GraphQL requests directly.
Using Postman, we can tune requests, analyze responses and debug issues. This is helpful when you are not sure whether the problem is on the front end or the back end.

3. CSS Lint
## Address: http://csslint.net/CSSLint is a tool used to help you find problems in CSS code. It can do basic syntax checking and use a set of preset rules to check problems in the code. The rules can be expanded.
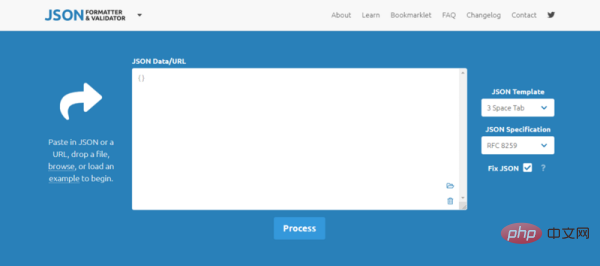
4. JSON Formatter & Validator
In unformatted JSON, it is difficult for us to find the syntax Error or incorrect key value as it is difficult to read. Reading and finding errors in compressed JSON files is more challenging when the JSON files are missing line returns and whitespace. You can use JSON formatting and validation tools to simply insert the compressed JSON and get a correctly formatted version as output. Additionally, the tool can validate JSON according to RFC standards.
5. Sentry## Address: https://sentry.io/welcome/
No matter how perfect the program is tested, bugs will inevitably exist. Some bugs will not appear every time. Code that runs well during testing may stop working when a user uses it. However, when the program is used by a user, When a crash occurs in front of you, you can't see the error. Of course you will say: "Hey, I have a log." But to be honest, the program generates a large number of logs every day and every hour, and they are distributed on various servers. And if you have multiple services being maintained, you will not be able to see the number of logs. When one day a user really can't stand it anymore and calls to yell, and you look for the logs again, you will find that the logs are actually useless: there is a lack of context, you don't know what user operations caused the exception, and there are too many exceptions (never Because of reading the log) I don’t know how to start etc.
Sentry is here to help us solve this problem. It is a real-time event logging and aggregation platform. It is specifically designed to monitor errors and extract all the information needed to perform appropriate post-mortem actions without any of the hassle of using standard user feedback loops.
Sentry is a logging platform, which is divided into client and server. The client (currently the client includes Python, PHP, C#, Ruby and other languages) is embedded in the middle of your application. If there is an exception in the program, Send a message to the server, and the server will record the message into the database and provide a web program for easy viewing. Sentry is written in python, with open source code, excellent performance, and easy expansion. Currently, famous users include Disqus, Path, mozilla, Pinterest, etc.
6、JSHint
## Address: https://jshint.com/JSHint is a Javascript code analysis and detection tool that not only helps us detect JS code errors and potential problems, but also helps us standardize code development. JSHint scans a program written in JavaScript and reports common errors and potential bugs. The underlying problem could be a syntax error, an error caused by an implicit type conversion, a leaked variable, or something else entirely. JSHint scans programs written in JavaScript and reports common errors and potential errors. The underlying problem could be a syntax error, an error due to an implicit type conversion, a variable leak, or something else entirely. The following is a sample function, use it to view the operation of JSHint:7, BrowserStack
Address: https://www.browserstack.com/Nowadays, there are more and more browsers with their own kernels, and their respective features are also very different. If as a front-end siege engineer you want to check the compatibility of various browsers of the website under different operating systems and mobile platforms, it is quite painful. I have seen people installing virtual machines on their own computers to configure various environments, setting up such environments on their own computers, and then testing them one by one. However, human energy is limited after all, and we cannot install so many systems on the same computer. So, Multi-browser. Fortunately, BrowserStack has been released, which is good news for the front-end. BrowserStack is an online cloud testing tool that provides website browser compatibility testing, so that development and testers no longer need to prepare many virtual machines or mobile phone simulators. BrowserStack is an online cloud application that provides website browser compatibility testing, supporting more than 100 browsers on 9 major operating systems. Supports local testing and integration with Visual Studio. Or you can go directly to http://modern.ie to test online. Register now and you can try it for free for three months. After three months, it will be charged. If you want to use it after three months but don’t want to pay, as a developer of China you know.8、whistle
Quote the official definitionwhistle , Pinyin [wēisǒu]) A cross-platform web debugging proxy tool based on Node. Similar tools include Fiddler on the Windows platform. It is mainly used to view and modify HTTP, HTTPS, and Websocket requests and responses. It can also be used as an HTTP proxy server. , unlike Fiddler's method of modifying request responses through breakpoints, whistle uses a method similar to configuring system hosts. All operations can be implemented through configuration, and supports multiple matching of domain names, paths, regular expressions, wildcards, wildcard paths, etc. method, and can extend the function through the Node moduleIn general, whistle has the following features
Why choose whistle?
First, whistle is a web debugging proxy tool with very powerful functions. As a front-end, we need to often deal with the application layer of the protocol. Mock data, cross-domain issues, cookie modification, mobile terminal debugging, etc. are all necessary skills for us, and whistle can solve 90% of them. QuestionSome scenarios that I often use are as follows:Second, in addition to being very powerful, it is also very convenient to use. You only need simple commands to open a web page and perform packet capture and other operations.
Third, unlike Fidder in window, which consumes a lot of CPU, Unlike Charles on Mac, which is not free, it is free, open source, and a cross-platform web debugging proxy tool
Fourth, it is implemented based on the Node module. It can be extended through the Node module
. If the above has not convinced you yet, I hope that the following actual combat can make you feel its power
(Learning video sharing: web front-end)
The above is the detailed content of What debugging tools are used for web front-end?. For more information, please follow other related articles on the PHP Chinese website!