Home > Article > Backend Development > How to generate a dynamic bar chart using Python
Currently, the official API documentation only provides a source code example of a bar chart. Maybe the platform is too busy and has no time to write documentation!
from matplotlib import pyplot as plt
import pandas as pd
import pynimate as nim

df = pd.DataFrame(
    {
        "time": ["1960-01-01", "1961-01-01", "1962-01-01"],
        "Afghanistan": [1, 2, 3],
        "Angola": [2, 3, 4],
        "Albania": [1, 2, 5],
        "USA": [5, 3, 4],
        "Argentina": [1, 4, 5],
    }
).set_index("time")

cnv = nim.Canvas()
bar = nim.Barplot(df, "%Y-%m-%d", "2d")
bar.set_time(callback=lambda i, datafier: datafier.data.index[i].strftime("%b, %Y"))
cnv.add_plot(bar)
cnv.animate()
plt.show()
Use pip directly to install the pynimate module. It should be noted that this module directly supports python versions 3.9 or above, which should be provided by each mirror station.
pip install pynimate

pip install matplotlib

pip install pandas
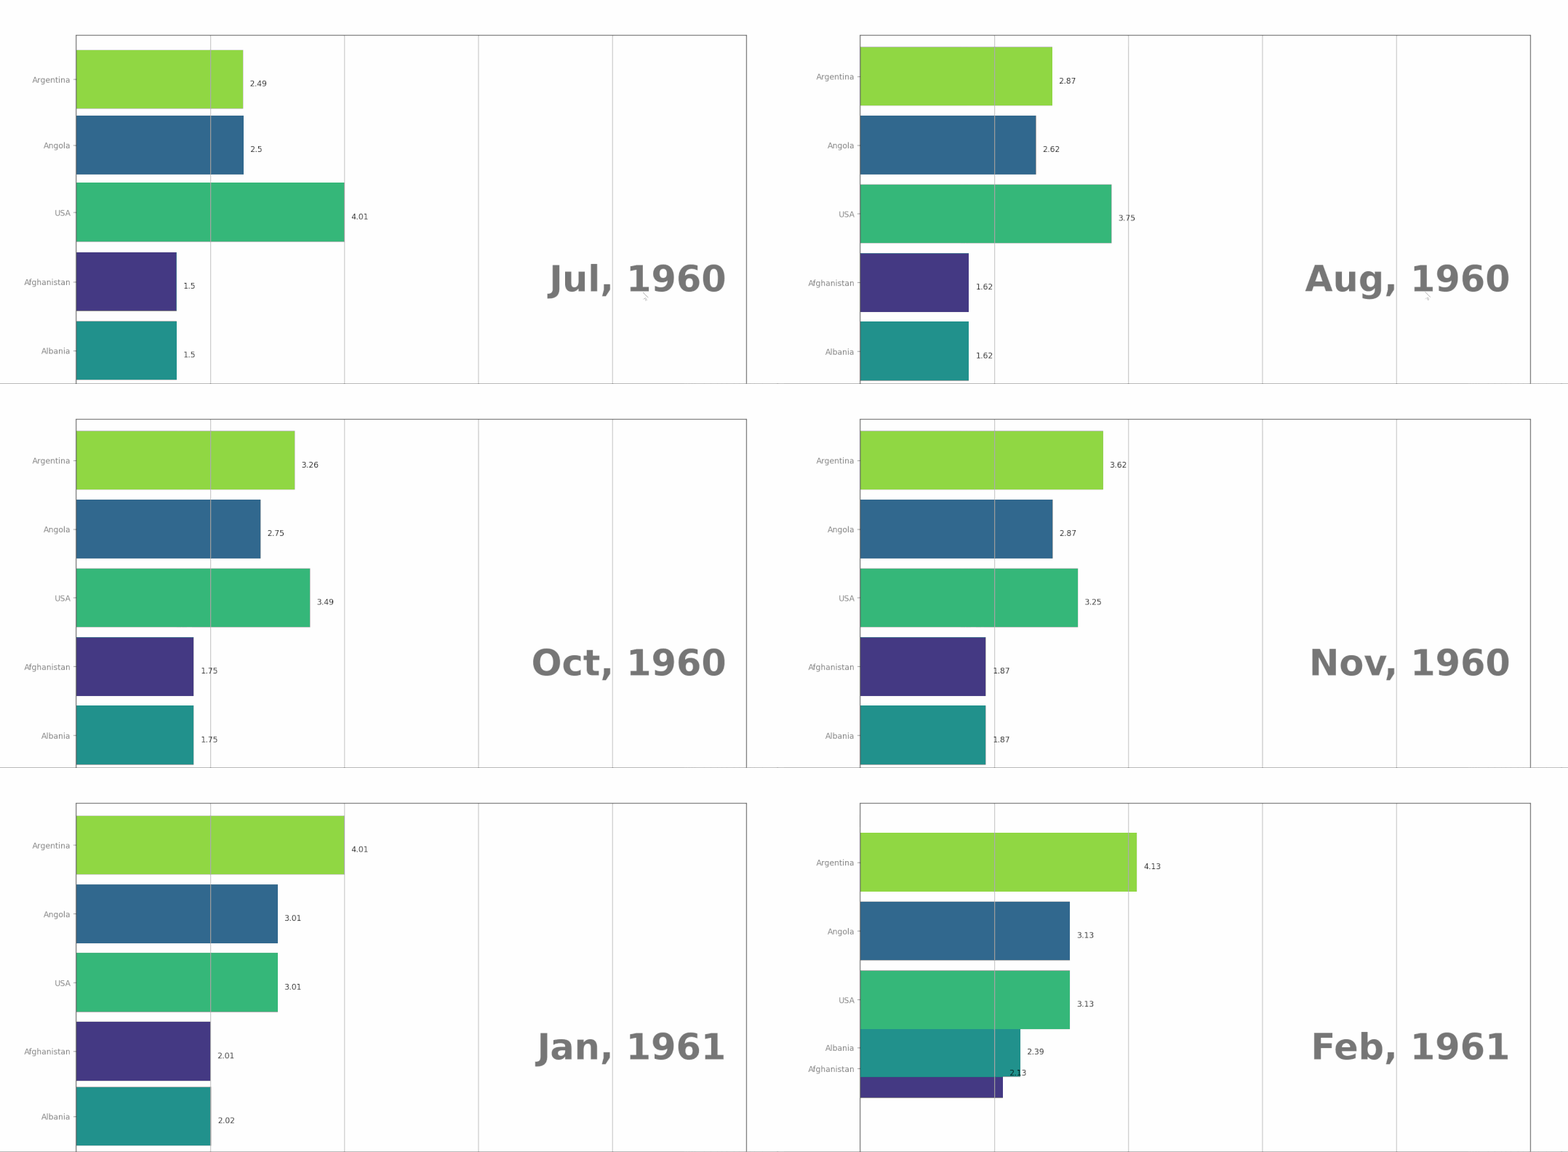
After the installation is completed, if we directly start the current .py module, the following dynamic bar chart effect will appear.

Compared with other python visualization modules, pynimate is excellent in that it can directly save the execution process of dynamic graphics as dynamic pictures in Gif format.
cnv.save("file", 24, "gif")In addition, the author of the pynimate module also provides a way to set up visual dynamic graphics in a customized way for our reference.
from matplotlib import pyplot as plt
import numpy as np
import pandas as pd
import os

dir_path = os.path.dirname(os.path.realpath(__file__))
import pynimate as nim


def post_update(ax, i, datafier, bar_attr):
    ax.spines["top"].set_visible(False)
    ax.spines["right"].set_visible(False)
    ax.spines["bottom"].set_visible(False)
    ax.spines["left"].set_visible(False)
    ax.set_facecolor("#001219")
    for bar, x, y in zip(
        bar_attr.top_bars,
        bar_attr.bar_length,
        bar_attr.bar_rank,
    ):
        ax.text(
            x - 0.3,
            y,
            datafier.col_var.loc[bar, "continent"],
            ha="right",
            color="k",
            size=12,
        )


df = pd.read_csv(dir_path + "/data/sample.csv").set_index("time")
col = pd.DataFrame(
    {
        "columns": ["Afghanistan", "Angola", "Albania", "USA", "Argentina"],
        "continent": ["Asia", "Africa", "Europe", "N America", "S America"],
    }
).set_index("columns")
bar_cols = {
    "Afghanistan": "#2a9d8f",
    "Angola": "#e9c46a",
    "Albania": "#e76f51",
    "USA": "#a7c957",
    "Argentina": "#e5989b",
}

cnv = nim.Canvas(figsize=(12.8, 7.2), facecolor="#001219")
bar = nim.Barplot(
    df, "%Y-%m-%d", "3d", post_update=post_update, rounded_edges=True, grid=False
)
bar.add_var(col_var=col)
bar.set_bar_color(bar_cols)
bar.set_title("Sample Title", color="w", weight=600)
bar.set_xlabel("xlabel", color="w")
bar.set_time(
    callback=lambda i, datafier: datafier.data.index[i].strftime("%b, %Y"), color="w"
)
bar.set_text(
    "sum",
    callback=lambda i, datafier: f"Total :{np.round(datafier.data.iloc[i].sum(),2)}",
    size=20,
    x=0.72,
    y=0.20,
    color="w",
)
bar.set_bar_annots(color="w", size=13)
bar.set_xticks(colors="w", length=0, labelsize=13)
bar.set_yticks(colors="w", labelsize=13)
bar.set_bar_border_props(
    edge_color="black", pad=0.1, mutation_aspect=1, radius=0.2, mutation_scale=0.6
)
cnv.add_plot(bar)
cnv.animate()
plt.show()
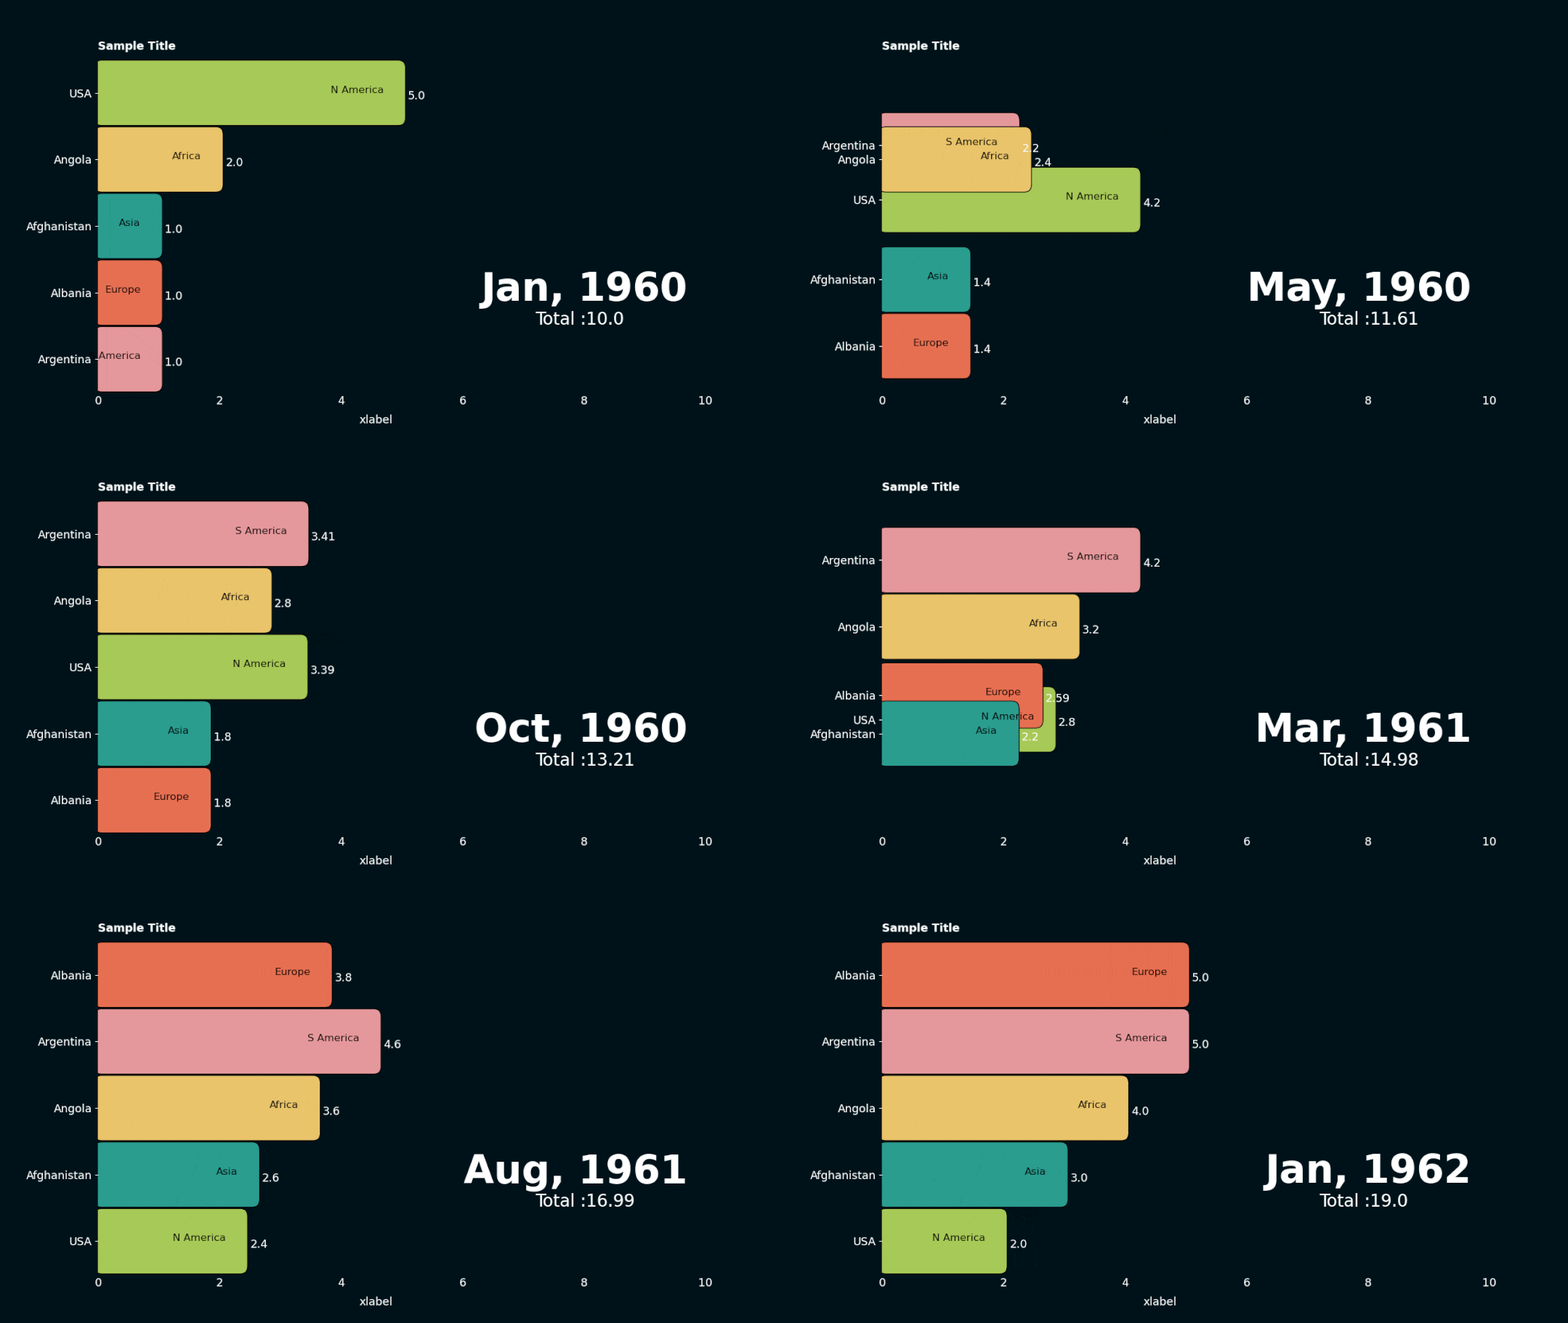
The dynamic bar chart effect achieved through customization is more cool, leaving more room for developers to play. The results are shown below.

The above is the detailed content of How to generate a dynamic bar chart using Python. For more information, please follow other related articles on the PHP Chinese website!