
Home > Article > Backend Development > Methods and steps for implementing Monte Carlo simulation in Python

Monte Carlo simulation is a method based on probability statistics that calculates the probability of an event occurring through random simulation. In project management, Monte Carlo simulation is mainly used to calculate the probability distribution of key indicators such as project duration and cost, helping project managers to better manage risks and make decisions.
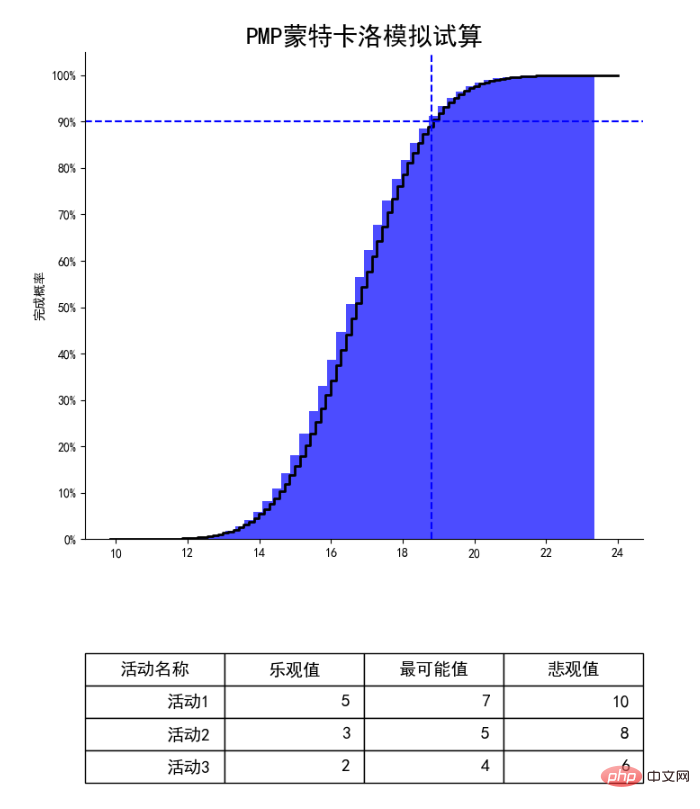
Let us look at the picture above. This picture is a Monte Carlo simulation for three project activities: Activity 1, Activity 2, and Activity 3. The simulation is based on three-point estimates of the three activities. Then the computer was asked to perform random budgets 1,000,000 times, and the above picture was obtained.
Let’s take the intersection of the blue dotted lines in the picture above as an example. What does this point refer to? Let's look at the Y-axis. The 90% here refers to the 90% probability of completion. The horizontal axis corresponding to this point is close to 19 days. In other words, through computer simulation 1 million times. The probability of completing the project in less than 19 days is 90%.
Students who have done projects all know that customers or leaders always want us to go faster, faster, and faster. The leader said that there were no 19 days, only 16 days. At this time, as a project manager, through the above graph, I found that the value of the X-axis corresponding to the Y-axis for 16 days is about 30%. Just ask the leader: The success rate is only 30%. Do you want to bet or not?
This is a good way of "scientific fortune telling". The key is simplicity, and probability theory to back you up.
How to calculate Monte Carlo simulation of project management in Python? It's actually very simple. We can use the numpy and matplotlib libraries in Python to perform calculations and drawings. Teacher Tian below gives the complete code:
#!/usr/bin/env python
# -*- coding:utf-8 -*-
"""
#-----------------------------------------------------------------------------
#                     --- TDOUYA STUDIOS ---
#-----------------------------------------------------------------------------
#
# @Project : di08-tdd-cdg-python-learning
# @File    : monte_carlo.py
# @Author  : tianxin.xp@gmail.com
# @Date    : 2023/3/12 18:22
#
# 用Python实现蒙特卡洛模拟
#
#--------------------------------------------------------------------------"""
from datetime import datetime

import matplotlib.pyplot as plt
import numpy as np
from matplotlib.ticker import FuncFormatter, MultipleLocator
from scipy.stats import norm

plt.rcParams['font.sans-serif'] = ['SimHei']
plt.rcParams['axes.unicode_minus'] = False


def to_percent(y, position):
    # 将纵轴用百分数表示
    return '{:.0f}%'.format(100 * y)


class Activity:
    """ 活动类,用于表示一个项目中的活动

   Attributes:
       name (str): 活动名称
       optimistic (float): 乐观时间
       pessimistic (float): 悲观时间
       most_likely (float): 最可能时间
   """

    def __init__(self, name, optimistic, pessimistic, most_likely):
        """
            初始化活动类

            Args:
                name (str): 活动名称
                optimistic (float): 乐观时间
                pessimistic (float): 悲观时间
                most_likely (float): 最可能时间
        """
        self.name = name
        self.optimistic = optimistic
        self.pessimistic = pessimistic
        self.most_likely = most_likely


class PMP:
    """
    PMP类用于进行项目管理中的相关计算:
    方法:
    monte_carlo_simulation : 蒙特卡洛模拟试算,包括计算项目工期、平均值、标准差、绘制积累图和概率密度曲线等功能。
    """

    def __init__(self, activities):
        """
        初始化PMP类,传入活动列表。
        :param activities: 活动列表,包括活动名称、乐观值、最可能值和悲观值。
        """
        self.activities = activities

    def monte_carlo_simulation(self, n):
        """
        进行蒙特卡洛模拟试算,计算项目工期、平均值、标准差、绘制积累图和概率密度曲线等。
        :param n: 模拟次数。
        """
        # 模拟参数和变量
        t = []
        for activity in self.activities:
            t.append(np.random.triangular(activity.optimistic, activity.most_likely, activity.pessimistic, n))

        # 计算项目工期
        project_duration = sum(t)

        # 计算平均值和标准差
        mean_duration = np.mean(project_duration)
        std_duration = np.std(project_duration)

        # 绘制积累图
        fig, (ax1, ax2) = plt.subplots(2, 1, figsize=(8, 10), gridspec_kw={'height_ratios': [3, 1]})

        ax1.hist(project_duration, bins=50, density=True, alpha=0.7, color='blue', cumulative=True)
        ax1.yaxis.set_major_locator(MultipleLocator(0.1))
        ax1.yaxis.set_major_formatter(FuncFormatter(to_percent))
        ax1.set_ylabel('完成概率')
        ax1.set_title('PMP蒙特卡洛模拟试算', fontsize=20)

        # 绘制概率密度曲线
        xmin, xmax = ax1.get_xlim()
        x = np.linspace(xmin, xmax, 100)
        p = norm.cdf(x, mean_duration, std_duration)
        ax1.plot(x, p, 'k', linewidth=2, drawstyle='steps-post')

        # 找到完成概率90%的点
        x_90 = norm.ppf(0.9, mean_duration, std_duration)

        # 绘制垂线
        ax1.axvline(x_90, linestyle='--', color='blue')
        ax1.axhline(0.9, linestyle='--', color='blue')

        # 隐藏右边和上方的坐标轴线
        ax1.spines['right'].set_visible(False)
        ax1.spines['top'].set_visible(False)

        # 添加表格
        col_labels = ['活动名称', '乐观值', '最可能值', '悲观值']

        cell_text = [[activity.name, activity.optimistic, activity.most_likely, activity.pessimistic] for activity in
                     self.activities]
        table = ax2.table(cellText=cell_text, colLabels=col_labels, loc='center')

        # 设置表格的字体大小和行高
        table.auto_set_font_size(False)
        table.set_fontsize(14)

        # # 设置表格的行高为1.5倍原来的高度
        for i in range(len(self.activities) + 1):
            table._cells[(i, 0)].set_height(0.2)
            table._cells[(i, 1)].set_height(0.2)
            table._cells[(i, 2)].set_height(0.2)
            table._cells[(i, 3)].set_height(0.2)

        ax2.axis('off')

        # 调整子图之间的间距和边距
        plt.subplots_adjust(hspace=0.3, bottom=0.05)

        # 保存图表
        now = datetime.now().strftime('%Y%m%d%H%M%S')
        plt.savefig('monte_carlo_simulation_{}.png'.format(now))

        # 显示图形
        plt.show()


if __name__ == '__main__':
    # 模拟参数和变量
    n = 1000000  # 模拟次数

    # 活动的工期分布
    activities = [
        Activity('活动1', 5, 10, 7),
        Activity('活动2', 3, 8, 5),
        Activity('活动3', 2, 6, 4)
    ]

    # 进行蒙特卡洛模拟
    pmp = PMP(activities)
    pmp.monte_carlo_simulation(n)
The above is the detailed content of Methods and steps for implementing Monte Carlo simulation in Python. For more information, please follow other related articles on the PHP Chinese website!