
Home > Article > Backend Development > Data analysis and prediction of Titanic survivors using Python

After we successfully register an account, we can find the Titanic sinking survival competition link in the competition link, as shown below:

After entering the competition page, you can see a brief introduction to the competition and other people's codes. Here we click Data.

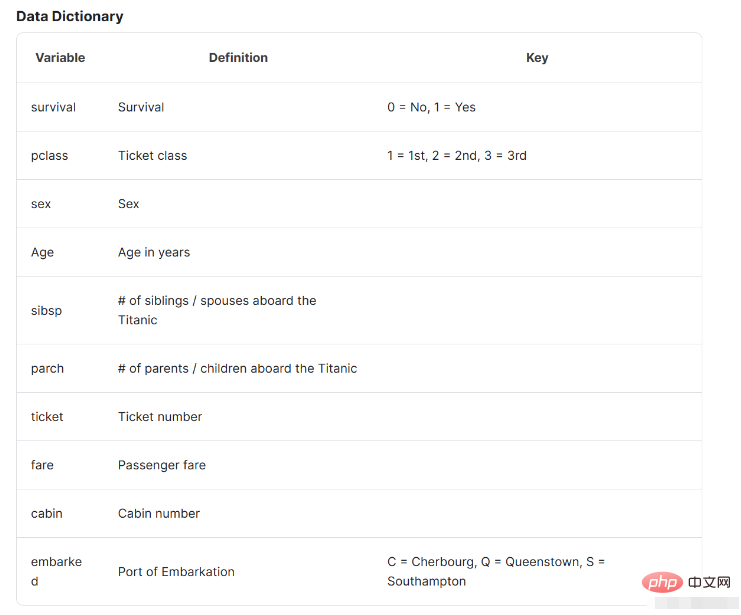
Pay attention to the data introduction below. The data introduction here will help us understand the basic situation of the data and what it represents.
After we obtain the data, we open the compilation environment and prepare to start data analysis. In this article, I use jupyter for data analysis. Of course, you can choose the compilation environment you are used to. Carry out follow-up work.
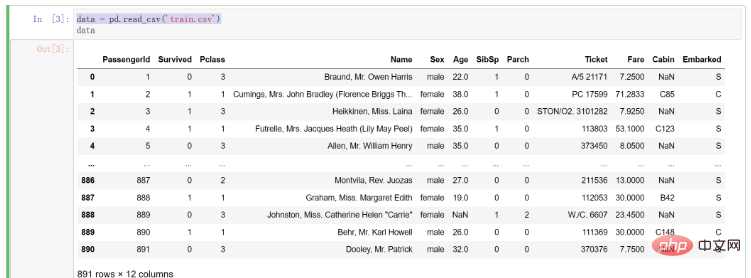
After getting the data, we first write code to read it into the compilation environment. The code is as follows:
# 导入pandas
import pandas as pd
# 将训练集数据导入
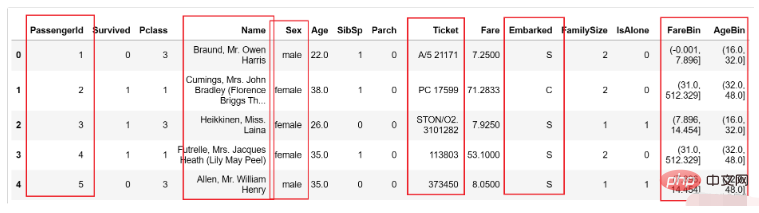
data = pd.read_csv('train.csv')The results after importing the data are as follows:
After we get the data, we need to conduct preliminary observation and data cleaning of the data. Here we introduce the Data Cleaning 4C Principles proposed by Kaggle bosses, which are:
Correcting: As the name suggests, correcting data is to correct outliers in the data deal with. For example, if there is data of 100 for age, then this must be an abnormal value. We will check different data for outliers to ensure they are normal and valid. However, we must be cautious when modifying the data from the original data, because the cornerstone of building an accurate model is the data, and the data determines the quality of the model
Completing (Supplement): It is necessary to supplement missing values and outliers found by us. Although in some models, it can automatically help us deal with missing values without processing (such as decision trees). In this part, we usually choose missing values with a small proportion of missing values to delete. For missing values with a relatively large proportion or a very large proportion, we will consider exploring some kind of pattern in the original data to fill them.
Creating: Feature engineering requires us to understand the original features and decide whether to extract new features. For example, in this problem we can consider segmenting age as a new feature. Of course, the premise here is that we have a deep understanding of the problem and explore whether the features we extract can really help the final model construction. This requires us to repeatedly verify, think about extracting features, and find features that are really helpful for different problems.
Converting: When targeting some specific data formats, we may also need to perform data conversion. This is of course very important. For example, some string type data needs to be converted into numerical form to represent it.
In this step, we will call the basic functions in pandas to make preliminary observations on the data. We first call info() to check the type and basic situation of the data. The code is as follows:
data.info()
The results are as follows:
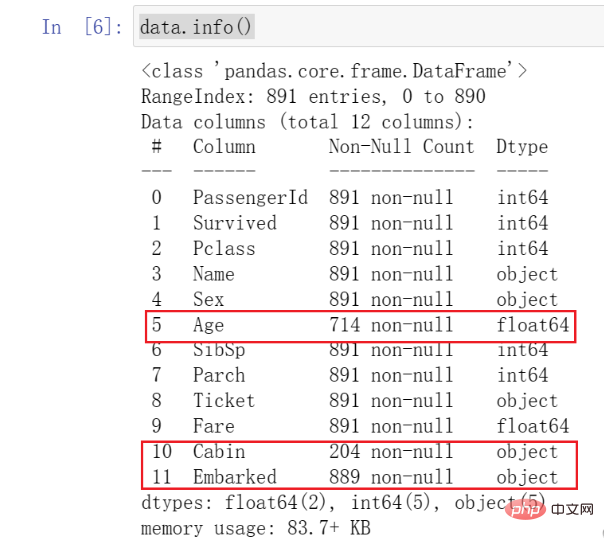
After we call this function, we can See all data types and basic conditions.
You need to pay attention to the data I marked here. We found that the number of Age data is much smaller than other data, which is what we call missing values. At the same time, you can see that Cabin and Embarked also have missing .
These all require our attention and some subsequent processing.
Subsequently, we call the describe() function to further observe the distribution of the data. This function can help us calculate the distribution and average of each column of data. The code is as follows:
data.describe()
The results are as follows:
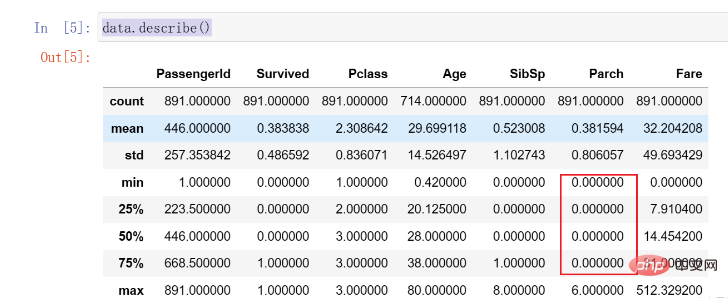
Here we find that 75% of the Parch data are 0, and there is an obvious distribution Uneven situations may need to be dealt with later.
In the previous section, we found that there are certain missing conditions in the data. We first visualize them, which can make our observation of the data more intuitive.
Here we use the missingno library to visualize missing data, which is more intuitive for visualizing missing data.
使用之前,请确保自己已经安装该库。
使用该库进行可视化的代码如下:
# 在数据中抽样100个单位
data_sample = data.sample(100)
msno.matrix(data_sample)
结果如下:
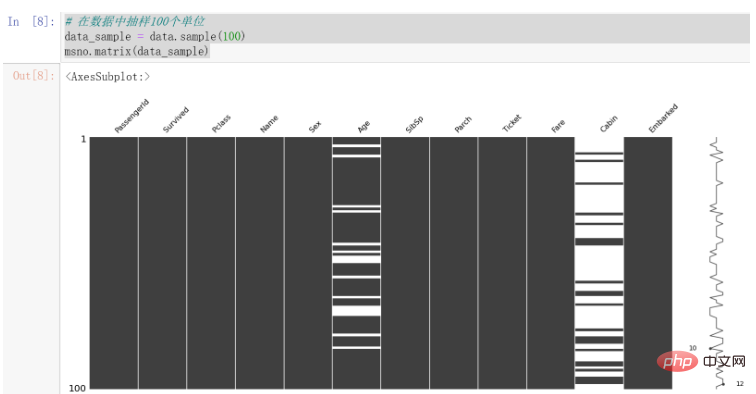
可以发现,Cabin的缺失值较为明显,Age也存在一些缺失值。
因为数据中每列代表的情况不尽相同,所以我们将针对数据进行不同的处理方法。
我们再通过代码来观察一下缺失的数据情况,代码与结果如下:
missing_data = data.isnull().sum()
missing_data = missing_data [missing_data >0]
missing_data
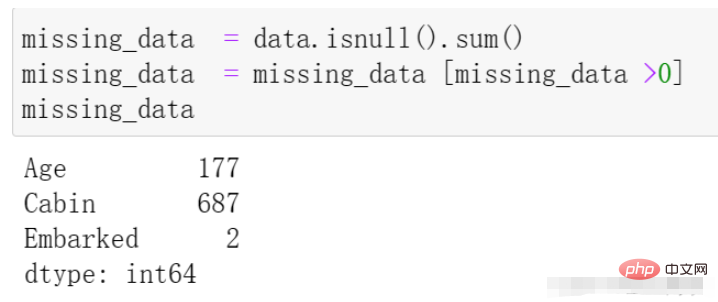
我们首先处理Embarked列,在上边的数据观察中发现其拥有两个缺失值,因为相对于全部的一千条数据来说其量级较小,所以我们在这里直接选择该列缺失的两条数据进行删除处理,代码如下:
# 在data中寻找Embarked的缺失值 找到后在原表中将其行删除
data.dropna(axis=0, how='any',subset=['Embarked'], inplace=True)
dropna 参数介绍:
axis: default 0指行,1为列
how: {‘any’, ‘all’}, default ‘any’指带缺失值的所有行;'all’指清除全是缺失值的
thresh: int,保留含有int个非空值的行
subset: 对特定的列进行缺失值删除处理
inplace: 这个很常见,True表示直接在原数据上更改
在上述观察中,我们发现Age存在一定的缺失情况,接下来我们对其进行处理。
我们由Kaggle中的数据介绍中了解到,其表示乘客的年龄,且缺失值相对来说较多,不能够直接采用删除的方式。
我们首先观察Age的分布情况,绘制年龄的直方图,代码如下:
data.hist(column='Age')
结果如下:
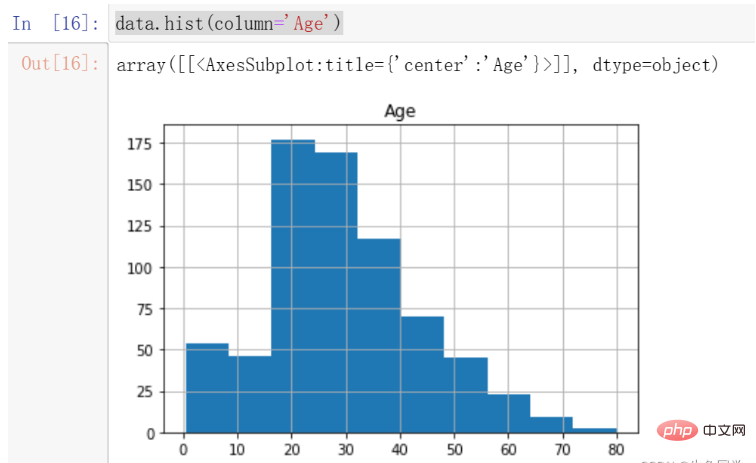
我们注意到,年龄的分布存在一定的偏态,这时候更适合采用中位数进行填充。
注意:偏态分布的大部分值都聚集在变量分布的一侧,中位数可以很好的表示中心趋势。
所以,我们对年龄的缺失值进行中位数的填充。代码如下:
data['Age'].fillna(data['Age'].median(), inplace=True)
至此,我们对于年龄的缺失值处理完毕。
我们首先看一下Cabin的数据解释:Cabin number(机舱号码)
对于该特征来说,仿佛对于最终的数据帮助不大。即使其对于最后的数据是非常重要的,由于其缺失值过多且不容易探寻其中的规律,我们还是选择对其做删除的处理。
代码如下:
# 这里我直接删除了该列
del data['Cabin']
至此,所有数据的缺失值处理完毕。
在本例中,我们能够进行检测并处理的主要是Age特征,因为我们预先知道其大概的范围。在这里我们绘制箱线图观察其数据的异常情况决定是否需要进行处理,代码如下:
data['Age'].plot.box()
结果如下:
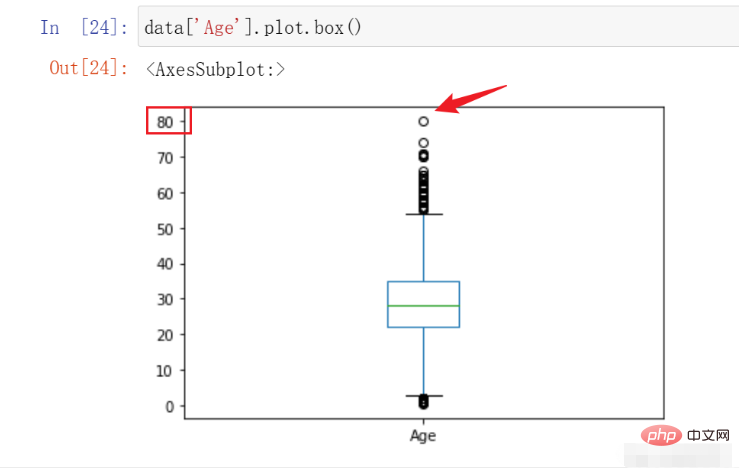
在这里,我们可以看到该数据的最高点在80,符合我们对于数据的预先认知,遂不进行处理。
在这部分中,要求我们对不同的特征有一定的了解以及认识,在这里我列出所有的特征含义。
特征名称含义survival是否存活,1表示存活,0表示没有pclass表示票的种类,分别为1,2,3等sex性别Age年龄sibsp在泰坦尼克号上的兄弟姐妹/配偶的数量parch在泰坦尼克号上的父母/子女人数ticket票号fare乘客票价cabin机舱号embarked上岸港口 ,C = Cherbourg, Q = Queenstown, S = Southampton
在这里,我们提取两个特征,分别是乘客家庭规模,是否独自一人,并对票价以及年龄进行分段构造两个新的特征。
注意:针对不同的项目采取的特征提取工作并不相同,因为这需要根据具体的业务进行分析并提取。
我们首先针对家庭规模以及是否独自一人创建新的两个特征,代码如下:
data['FamilySize'] = data['SibSp'] + data['Parch'] + 1

data['IsAlone'] = 1
data['IsAlone'].loc[data['FamilySize'] > 1] = 0
然后,我们对年龄和票价进行分段,代码如下:
data['FareBin'] = pd.qcut(data['Fare'], 4)
data['AgeBin'] = pd.cut(data['Age'].astype(int), 5)
这里简单介绍一下上述两个函数的区别与作用
qcut:根据传入的数值进行等频分箱,即每个箱子中含有的数的数量是相同的。
cut:根据传入的数值进行等距离分箱,即每个箱子的间距都是相同的。
特别的,在本节中特征工程的过程要根据实际业务进行不同的特征提取,这个过程需要我们对业务有足够的理解程度。几个好的特征对后续的模型精确程度有很大的积极影响。
某些特定的格式在很多模型中其实是不适用的,在本例中经过上述处理后的数据如下所示:
图中的性别等内容都为字符类型,这显然在模型中存在一定的不兼容情况,这就需要我们进行一定程度的格式转换。
在本部分中,我们要处理的有以下几个部分:
PassengerId:用户id的部分对后面的预测仿佛用处不大,我们对其进行删除。Name:这里的名字中有MR.MISS等信息,这可能对后续的模型有帮助,我们对其进行处理保留。Sex:需要进行编码使用,因为它是字符串类型。Ticket:仿佛用处不大,这里我们选择删除。Embarked:需要进行编码使用,因为它是字符串类型。FareBin:需要进行编码使用,因为它是一个范围。AgeBin:需要进行编码使用,因为它是一个范围。
我们首先对需要删除的两列进行删除的操作,代码如下:
del data['PassengerId']
del data['Ticket']
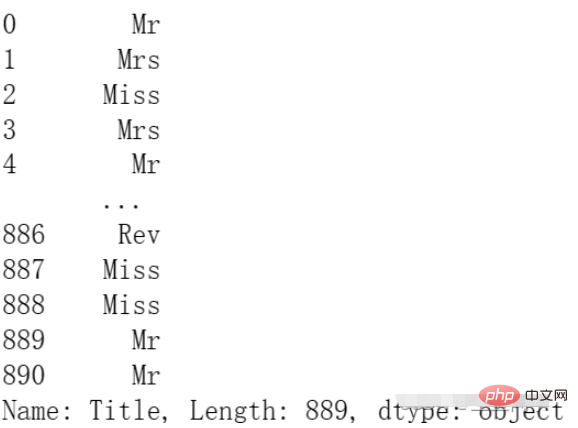
然后我们对Name进行处理,将其中的身份信息提取出来,代码如下:
data['Title'] = data['Name'].str.split(", ", expand=True)[1].str.split(".", expand=True)[0]结果如下:
最后,我们对需要编码的数据进行编码:
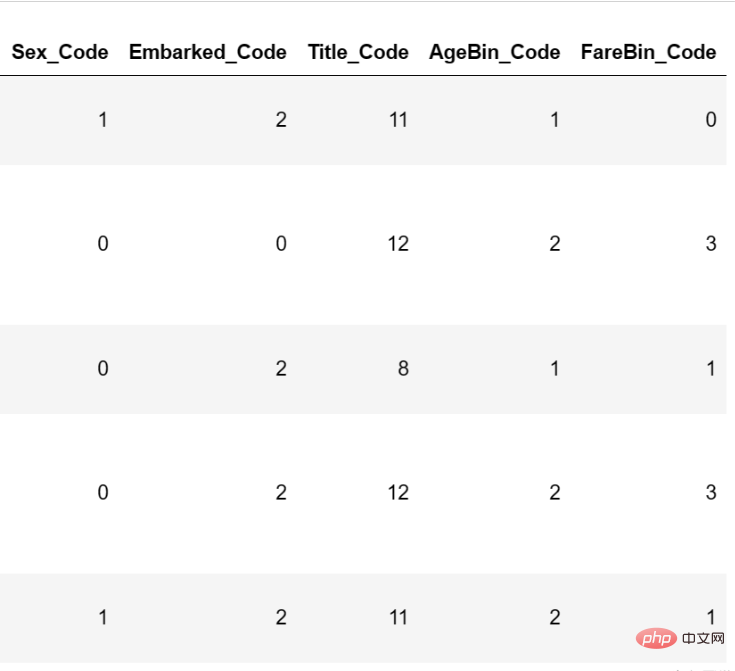
from sklearn.preprocessing import OneHotEncoder, LabelEncoder
label = LabelEncoder()

data['Sex_Code'] = label.fit_transform(data['Sex'])
data['Embarked_Code'] = label.fit_transform(data['Embarked'])
data['Title_Code'] = label.fit_transform(data['Title'])
data['AgeBin_Code'] = label.fit_transform(data['AgeBin'])
data['FareBin_Code'] = label.fit_transform(data['FareBin'])
编码后的结果如下:
至此,数据格式转换已经完毕。
在本节中,我们将基于上述数据进行模型的构建,并且通过不同的评价指标进行构建。
在这里我将会使用基础的分类模型进行模型的构建,并挑选出初步表现最好的模型进行参数调节。代码如下:
# 处理不需要的数据列
data_x = data.copy()
del data_x['Survived']
del data_x['Name']
del data_x['Sex']
del data_x['FareBin']
del data_x['AgeBin']
del data_x['Title']
del data_x['Embarked']
# 构建y
data_y = data['Survived']
# 导入包
from sklearn import svm, tree, linear_model, neighbors, naive_bayes, ensemble, discriminant_analysis, gaussian_process
from sklearn.model_selection import cross_val_score
# 定义常用的几种分类模型
MLA = {
    #随机森林
    '随机森林':ensemble.RandomForestClassifier(),
    #逻辑回归
    '逻辑回归':linear_model.LogisticRegressionCV(max_iter=3000),
    #SVM
    'SVM':svm.SVC(probability=True),
    #树模型
    '树模型':tree.DecisionTreeClassifier(),
    }
# 进行5折交叉验证并选择f1作为评价指标
for model_name in MLA:
    scores = cross_val_score(MLA[model_name], X=data_x, y=data_y, verbose=0, cv = 5, scoring='f1')
    print(f'{model_name}:',scores.mean())
结果如下:
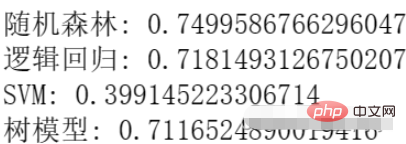
我们可以看到,目前随机森林的效果最好,所以我们选择随机森林进行参数调节。
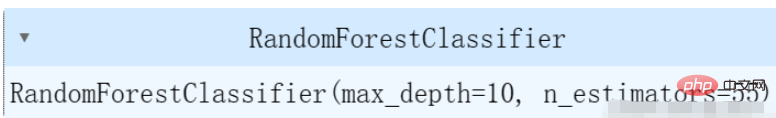
在这里我们选择使用网格调参的方式进行参数调节,代码如下:
from sklearn.model_selection import GridSearchCV

n_estimators = [3,5,10,15,20,40, 55]
max_depth = [10,100,1000]

parameters = { 'n_estimators': n_estimators, 'max_depth': max_depth}

model = ensemble.RandomForestClassifier()
clf = GridSearchCV(model, parameters, cv=5)
clf = clf.fit(data_x, data_y)
clf.best_estimator_
结果如下:
在这里,我们选择了几个简单的参数进行调节,可以根据自己的实际情况对不同的参数进行调节。我们再进行一次交叉验证求平均值看一下效果,结果如下:
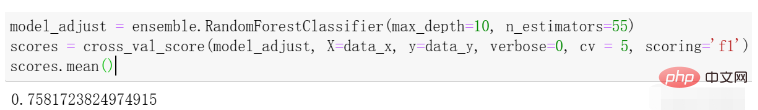
可以看到与刚才的效果相比有一些提升。
The above is the detailed content of Data analysis and prediction of Titanic survivors using Python. For more information, please follow other related articles on the PHP Chinese website!