
Home > Article > Backend Development > Easily build a tree heat map with one line of Python code


Today I will learn a visualization technology with you: building a treemap treemap. Tree diagrams are easy to visualize and easy to understand. Treemaps convey different sizes of data by displaying rectangles of different sizes. It is generally believed that larger rectangles represent a large part of the whole, while smaller rectangles represent a small part of the whole. In this article, Yun Duojun will learn with you how to use the Squarify library to build a tree diagram in Python.
Dendrograms use rectangles of different sizes nested together to visualize hierarchical data. The size of each rectangle is proportional to the overall amount of data it represents. These nested rectangles represent the branches of the tree, hence the name. In addition to size, each rectangle has a unique color that represents a unique category. Treemaps are widely used in industries ranging from financial institutions to sales organizations.
The tree diagram was first invented in the early 1990s by Professor Ben Shneiderman of the Human-Computer Interaction Laboratory at the University of Maryland. The idea behind this visualization is to compare quantities by size in a fixed space. Now, we'll look at how to actually build a word cloud.
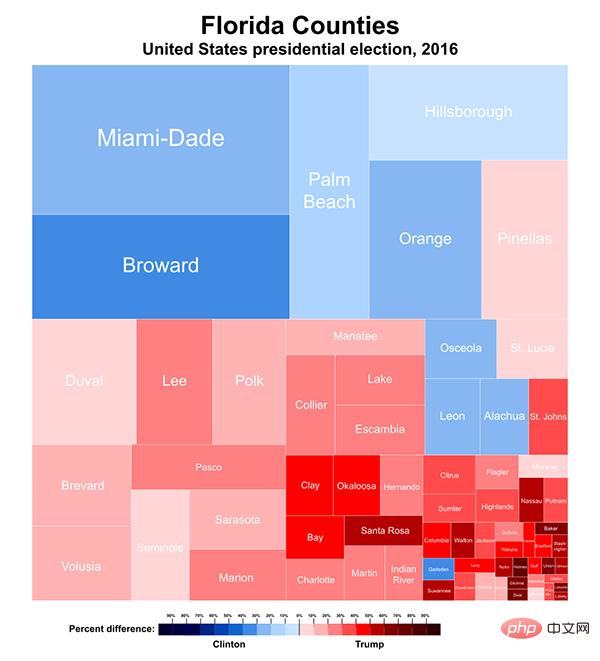
Florida dendrogram source: https://commons.wikimedia.org
In Python, you can use Squarify to build dendrograms directly. And it can be easily constructed with only one line of code squarify.plot(data).
!pip install squarify
import matplotlib.pyplot as plt
import squarify
Randomly generate a list of values, these The values will be passed into our plot as data.
data = [500, 250, 60, 120]
Use the **squarify.plot()** method to construct a dendrogram. Here, the random data variable data is used as a parameter of this squarify.plot method. Additionally, append a line of decorator code plt.axis('off') to hide the axes of the dendrogram.
squarify.plot(data)
plt.axis('off')
plt.show()
import matplotlib.pyplot as plt
import squarify
data = [500, 250, 60, 120]
squarify.plot(data)
plt.axis('off')
plt.show()
When executing this code, we get:

Every time this code is executed , it generates a set of nested rectangles of random colors.
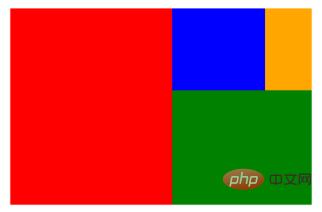
With the help of the parameters of the .plot() method, more modifications can be added to the dendrogram. The color, label, and fill of the treemap can be controlled by explicitly specifying properties.
import matplotlib.pyplot as plt
import squarify
sizes = [500, 250, 120, 60]
color = ['red', 'green', 'blue', 'orange']
squarify.plot(sizes,color=color)
plt.axis('off')
plt.show()
When executing this code, we get:
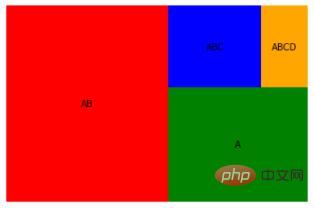
Different label values can be added explicitly by passing a list to the labels property of squarify.plot(). This will overwrite existing tags or add the tag to our dendrogram if it doesn't exist yet. Labels will be added to the dendrogram in the same order as in the list passed to .plot().
import matplotlib.pyplot as plt
import squarify
labels = ['A', 'AB', 'ABC', 'ABCD']
sizes = [500, 250, 120, 60]
color = ['red', 'green', 'blue', 'orange']
squarify.plot(sizes,color=color, label = labels)
plt.axis('off')
plt.show()
When executing this code, we get:
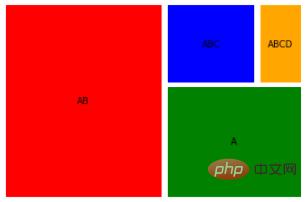
in the dendrogram can be found in the dendrogram Add pads to separate each rectangle from each other in the treemap. This will help distinguish the rectangles better. This is useful when there are a large number of categories or rectangles. Can be called by setting the pad parameter to True.
import matplotlib.pyplot as plt
import squarify
labels = ['AB', 'A', 'ABC', 'ABCD']
sizes = [500, 250, 120, 60]
color = ['red', 'green', 'blue', 'orange']
squarify.plot(sizes,color=color, label = labels, pad = True)
plt.axis('off')
plt.show()
When executing the code, we get:
From this point of view, building a tree diagram can be said to be A piece of cake. In addition to the squarify library, dendrograms can be built using several other libraries in Python. Such as the popular plotly library. In today’s second tweet, its application cases are introduced, interested friends can take a look.
import plotly_express as px
import plotly.graph_objects as go
px.treemap(names = name, parents = parent)
go.Figure(go.Treemap(labels = name, parents = parent,))
Of course, there are many BI tools that can be used to build tree diagrams more conveniently and simply.
Sometimes, ambiguities can occur in the dendrogram. If there are multiple categories with the same number (or rectangle size) and the same shade of color, it ends up being difficult for the user to differentiate between them. So when building a dendrogram, you must always consider the number of categories involved and the color mapping.
The above is the detailed content of Easily build a tree heat map with one line of Python code. For more information, please follow other related articles on the PHP Chinese website!