
Home > Article > Backend Development > Don’t know how to make charts? Ten Python data visualization libraries to help you!


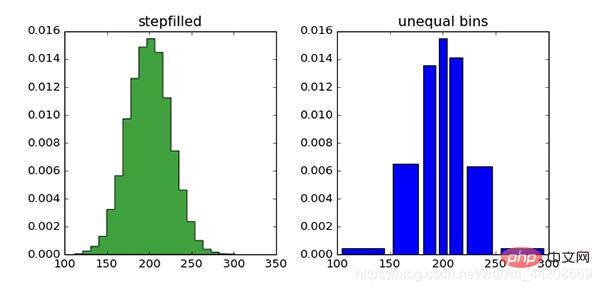
Two histograms
matplotlib is the leader of Python visualization libraries. After more than ten years, it is still the most commonly used drawing library for Python users. Its design is very close to MATLAB, a commercial programming language designed in the 1980s.
Since matplotlib is the first Python visualization library, there are many other libraries built on it or calling it directly.
For example, pandas and Seaborn are outsourcing of matplotlib. They allow you to call matplotlib methods with less code.
Although matplotlib can be used to easily obtain general information about the data, it is not so easy to quickly and easily create charts for publication.
As Chris Moffitt mentioned in "Introduction to Python Visualization Tools": "It is very powerful and very complex."
matplotlib has a strong default function of the 1990s. The style of the pictures has also been complained about for many years. The upcoming release of matplotlib 2.0 is said to include many more fashionable styles.
Developer: John D. Hunter
More information://m.sbmmt.com/link/a563b6d5abbf137175059d6bb14672cc
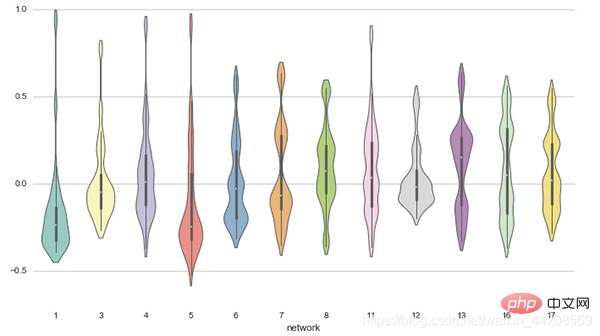
Violinplot (Michael Waskom)
Seaborn uses matplotlib to create beautiful charts with simple code.
The biggest difference between Seaborn and matplotlib is that its default drawing style and color matching have a modern aesthetic.
Since Seaborn is built on matplotlib, you need to understand matplotlib to adjust Seaborn's default parameters.
Developer: Michael Waskom
More information://m.sbmmt.com/link/b93f11867481fc6d77908aea58ba6198
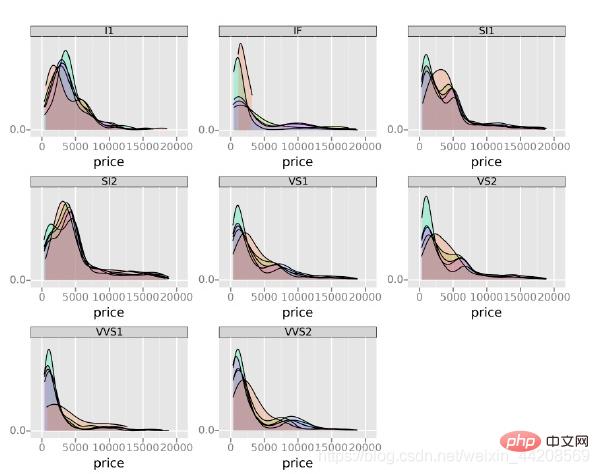
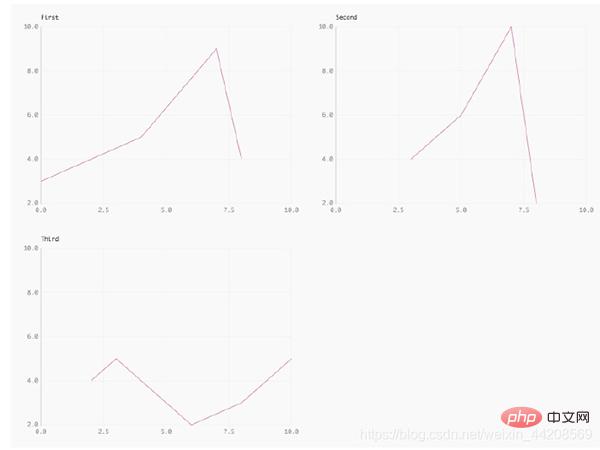
Small multiples (ŷhat)
ggplot is a plotting package based on R, ggplot2, and also uses the source of "Image Grammar" ( Concepts in The Grammar of Graphics.
The difference between ggplot and matplotlib is that it allows you to overlay different layers to complete a picture. For example you can start with the axis, then add points, add lines, trend lines, etc.
Although "Image Grammar" has been praised as a drawing method that is "close to the thinking process", users who are accustomed to matplotlib may need some time to adapt to this new way of thinking.
The author of ggplot mentioned that ggplot is not suitable for making very personalized images. It sacrifices image complexity for operational simplicity.
ggplot is tightly integrated with pandas, so it's best to store your data in a DataFrame when using ggplot.
ggplot is tightly integrated with pandas, so when you use it, It's better to read your data into a DataFrame.
Developer: ŷhat
More information://m.sbmmt.com/link/be23c41621390a448779ee72409e5f49
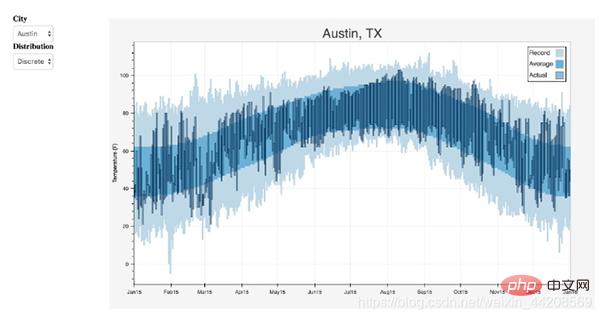
Interactive weather statistics for three cities (Continuum Analytics)
Like ggplot, Bokeh is also based on the concept of "Graphic Grammar".
But unlike ggplot, it is completely based on Python and not referenced from R.
Its advantage is that it can be used to create interactive charts that can be used directly on the network. Charts can be output as JSON objects, HTML documents or interactive web applications.
Boken also supports data streaming and real-time data. Bokeh offers three levels of control for different users.
The highest level of control is used for quick graphing, mainly for making common images, such as histograms, box plots, and histograms.
The medium level of control allows you to control basic elements of the image (such as points in a distribution plot) just like matplotlib.
The lowest level of control is primarily intended for developers and software engineers.
It has no default value, you have to define each element of the chart.
Developer: Continuum Analytics
More information://m.sbmmt.com/link/fdad3b5b2200b598dfde9517e5b426a8
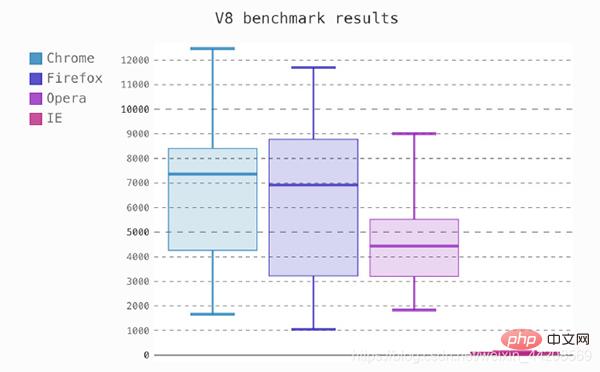
Box plot (Florian Mounier)
pygal, like Bokeh and Plotly, provides interactive graphics that can be embedded directly into the web browser.
The main difference from the other two is that it can output charts into SVG format.
If your data size is relatively small, SVG is enough. But if you have hundreds or thousands of data points, the SVG rendering process will become very slow.
Since all charts are encapsulated into methods, and the default style is also very beautiful, you can easily create beautiful charts with a few lines of code.
Developer: Florian Mounier
More information://m.sbmmt.com/link/bf5d232e6c54a84b97769a91adb1642f
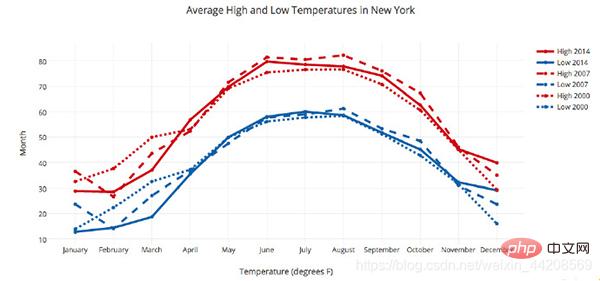
Line plot (Plotly)
You may have heard of the online graphing tool Plotly, but did you know you can use it through Python? ?
Plotly is dedicated to the production of interactive charts like Bokeh, but it provides several chart types that are difficult to find in other libraries, such as contour plots, tree plots, and three-dimensional charts.
Developer: Plotly
More information://m.sbmmt.com/link/d01c25576ff1c53de58e0e6970a2d510
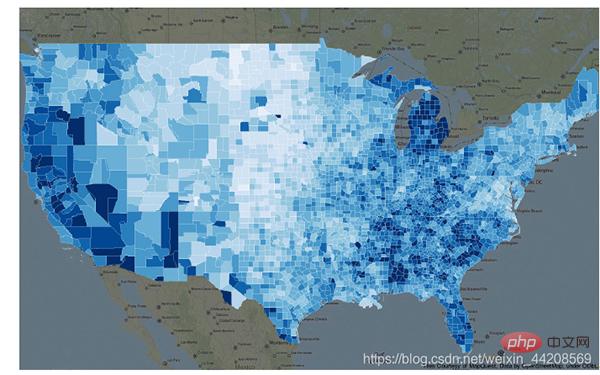
Choropleth (Andrea Cuttone)
geoplotlib is a toolbox for producing maps and geographically related data.
You can use it to create a variety of maps, such as contour maps, heat maps, and point density maps.
You must install Pyglet (an object-oriented programming interface) to use geoplotlib. However, since most Python visualization tools do not provide maps, it is quite convenient to have a tool dedicated to drawing maps.
Developer: Andrea Cuttone
More information://m.sbmmt.com/link/a9cf46a38a9b05e959f33215e5cdc38a
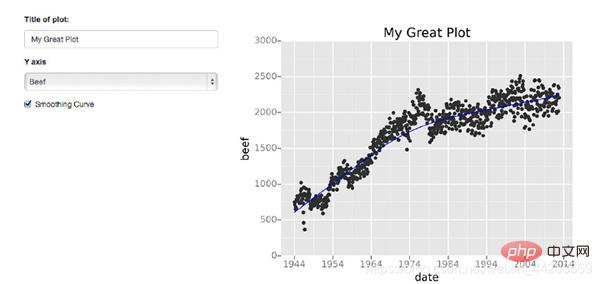
Scatter plot with trend line (David Robinson)
Gleam borrows the inspiration of Shiny in R. It allows you to turn your analysis into an interactive web application using only Python programs. You don't need to know HTML CSS or JavaScript.
Gleam can use any Python visualization library.
When you create a chart, you can add a field to it so users can use it to sort and filter the data.
Developer: David Robinson
More information://m.sbmmt.com/link/c0ad6deb373037e7f63f219c850e3396
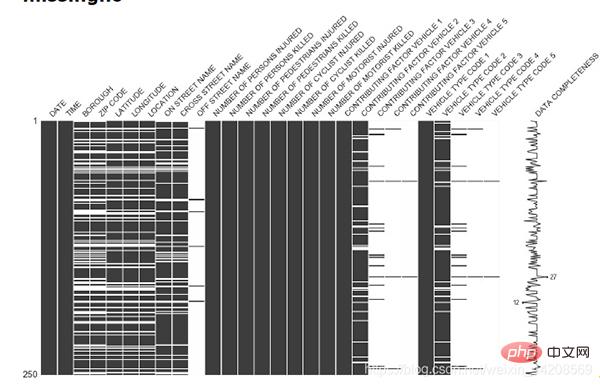
Nullity matrix (Aleksey Bilogur)
Missing data is forever painful.
missingno uses images to quickly assess the situation of missing data, instead of wading through the data table.
You can sort or filter the data based on its completeness, or consider correcting the data based on the heat map or tree map.
Developer: Aleksey Bilogur
More information://m.sbmmt.com/link/bc05ca60f2f0d67d0525f41d1d8f8717

The best definition of Leather comes from its author Christopher Groskopf.
"Leather is for people who need a chart now and don't care if the chart is perfect."
It can be used with all data types and generates SVG images, so that when you adjust Image size is increased without losing image quality.
The above is the detailed content of Don’t know how to make charts? Ten Python data visualization libraries to help you!. For more information, please follow other related articles on the PHP Chinese website!