WeChat web developer tools
WeChat web developer tools
X5 Blink kernel
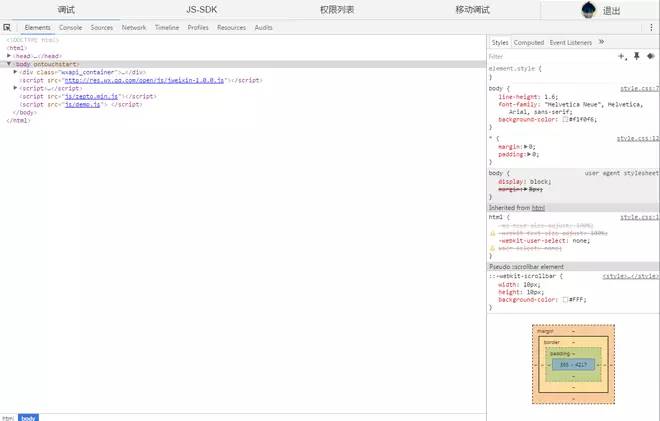
4. Use the integrated Chrome DevTools to assist in developmentThe tool interface mainly consists of several parts, as shown in the figure below: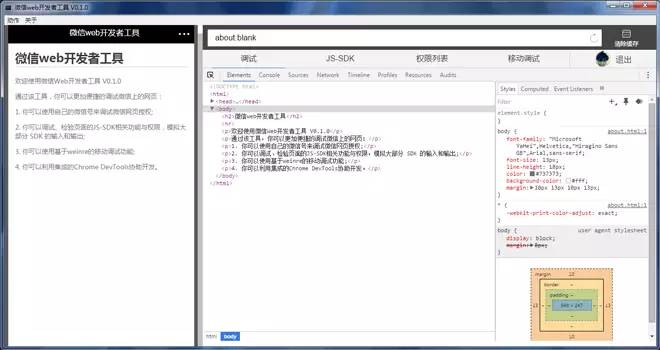
Debugging WeChat web page authorization
Previously when developing web page authorization functions based on WeChat, developers usually needed to enter the URL on their mobile phone to obtain user information. In order to carry out development and debugging work, however, due to the many limitations of mobile phones, this process is very inconvenient. By using WeChat web developer tools, developers can now perform this kind of debugging directly on PC or Mac. The specific steps are:
1. Developers can click "Login" in the debugger, scan the QR code using WeChat on their mobile phone to log in, and use real user identities (test accounts are supported) to develop and debug WeChat webpage authorization. . Please confirm the mobile phone login page. The bound official account is "WeChat Web Developer Tools", as shown in the figure below:
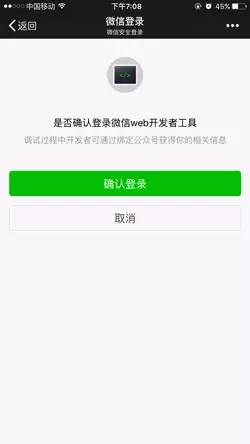
2 .In order to ensure the security of developers’ identity information, we require developers to establish a binding relationship with their WeChat account for the public account they wish to debug. The specific operation is: log in to the management backend with the official account, enable the developer center, and send a binding invitation to the developer's WeChat account on the developer tools - web developer tools page. The binding page is as shown below:

3. Developers can complete the binding by accepting the invitation on WeChat on their mobile phones. Each official account can be bound to up to 10 developer WeChat IDs at the same time. The invitation confirmation page is as shown below:
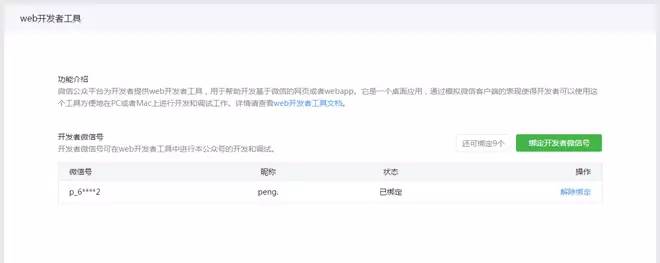
4. After completing the login and binding, developers can start debugging WeChat web authorization Yes, Note that you can only debug the official account you have bound :
Non-silent authorized URL example: https://open.weixin.qq. com/connect/oauth2/authorize?appid=wx841a97238d9e17b2&redirect_uri=http://cps.dianping.com/weiXinRedirect&response_type=code&scope=snsapi_userinfo
&state=type=quan,url=http://mm.dianping.com/weixin/account/home
Open a similar authorization page URL in WeChat web developer tools (the sample cannot be used directly To use, please change to the binding completed public account authorization page URL), the webview simulator displays the effect as shown in the figure:
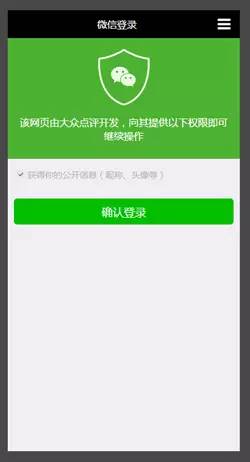
Click "Confirm Login" to bring the user information Jump to the third-party page, which is very convenient for subsequent development and debugging.
Silent authorization URL sample: https://open.weixin.qq.com/connect/oauth2/authorize?appid=wx841a97238d9e17b2&redirect_uri=http://cps.dianping.com /weiXinRedirect&response_type=code&scope=snsapi_base
&state=type=quan,url=http://mm.dianping.com/weixin/account/home
Open something like this in WeChat web developer tools The authorization page URL (the sample cannot be used directly, please replace it with the binding official account authorization page URL) will automatically jump to the third-party page.
Note: If a proxy is used, the proxy itself needs to support https direct connection to debug the https page.
Simulating JSSDK permission verification
Through web developer tools, you can simulate JSSDK requests in the WeChat client and visually see to the authentication results and log. Take the WeChat JSSDK DEMO page as an example:
http://demo.open.weixin.qq.com/jssdk
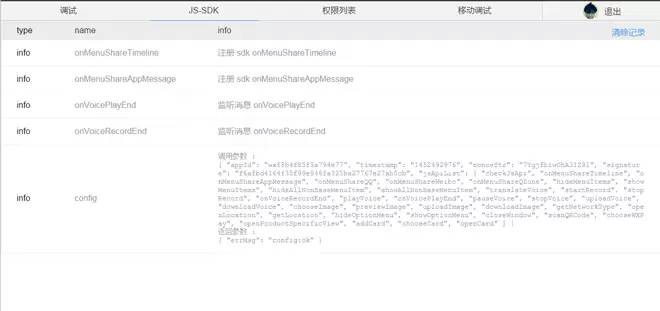
Open the URL in the debugger, you can You can conveniently see the verification status of wx.config on the current page and the call log of JSSDK in the JS-SDK Tab on the right. The following is the page that passed the verification:
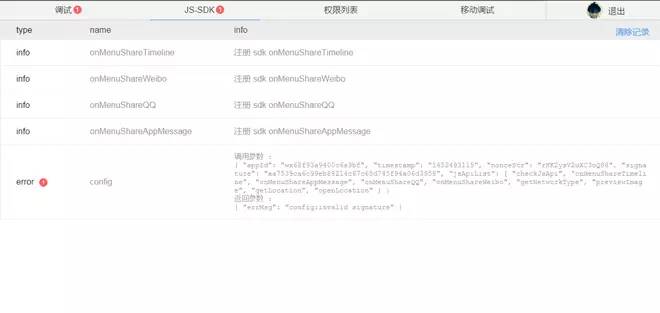
The following is the page that failed the verification:
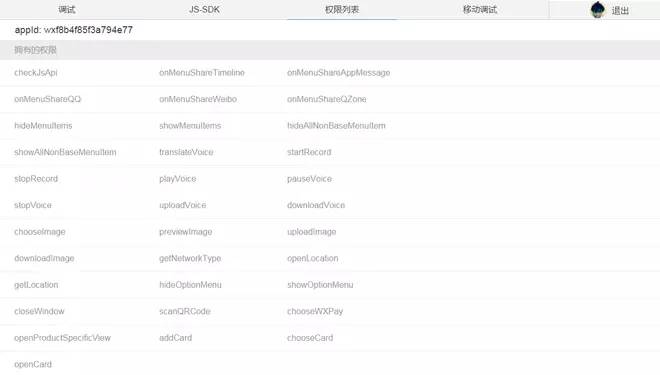
In the "Permission List" Tab, you can query the JS-SDK list that the current page has permissions:
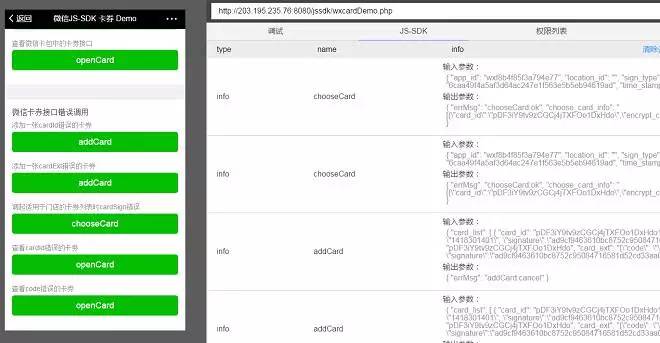
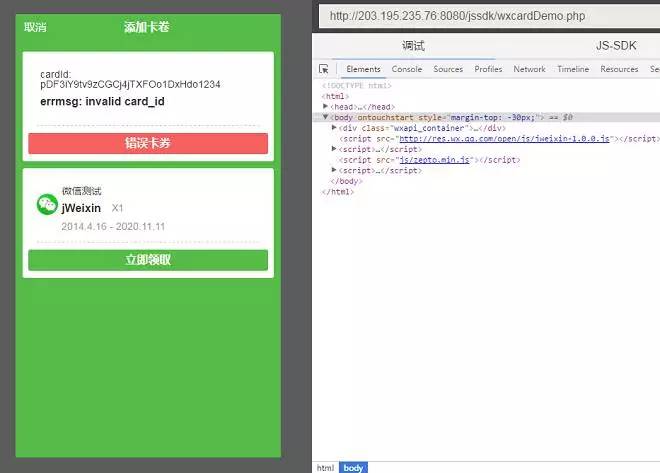
Combined with the left The WeChat Webview simulator on the side can intuitively debug the effects of JSSDK, such as using WeChat web developer tools to debug the card JSSDK Demo:
http://203.195.235.76:8080/jssdk/wxcardDemo .php
(1) Preparation work
2. Confirm whether the mobile device supports the remote debugging function
Open the WeChat web developer tool, select the "Mobile Debugging" tab, and click to verify whether the mobile device supports it. Then use your mobile device to scan the pop-up QR code to get support information on your device.
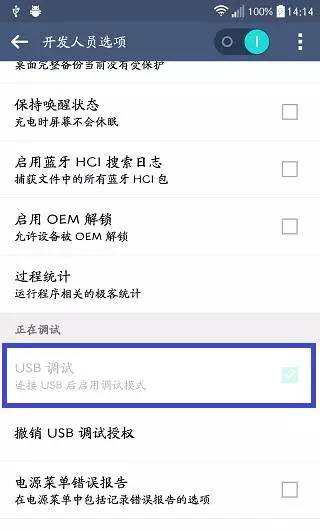
3. Turn on the USB debugging function in the mobile device
1. Turn on the mobile device and enter "Settings"->"Developer Options"
2 .Check "USB debugging function"
Tencent Mobile Manager to install the device driver.
5. Open the inspector function of the X5 Blink kernel Open the WeChat web developer tool, select the "Mobile Debugging" tab, and use the device to scan the QR code in the "Debugging Steps". As shown below, check "Whether to turn on the TBS kernel Inspector debugging function" and restart WeChat.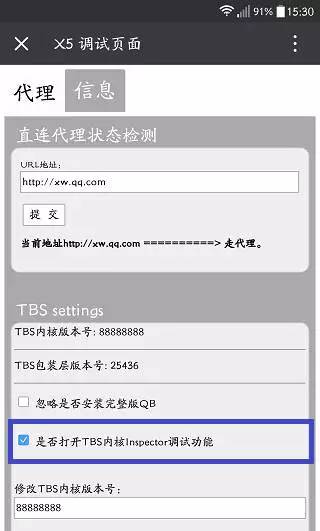
(2) Start debugging
After connecting the mobile device to PC or Mac using a USB data cable, click to open the "Mobile Debugging" tab of the WeChat web developer tool, select the X5 Blink debugging function, a new window will open, and you can access any web page in WeChat Start debugging. For more information about the X5 Blink core, you can view the Official website introduction.
When all preparations are completed, you can see the basic information of the current device in the window:
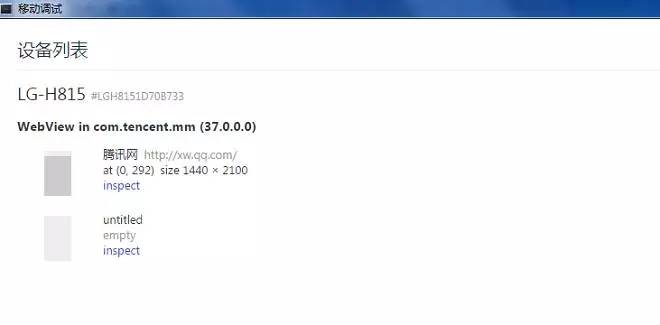
Click "inspect" on any page, Open a new window and developers will see the familiar debugging interface:
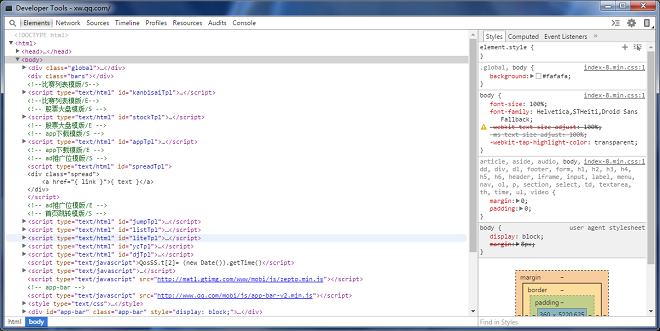
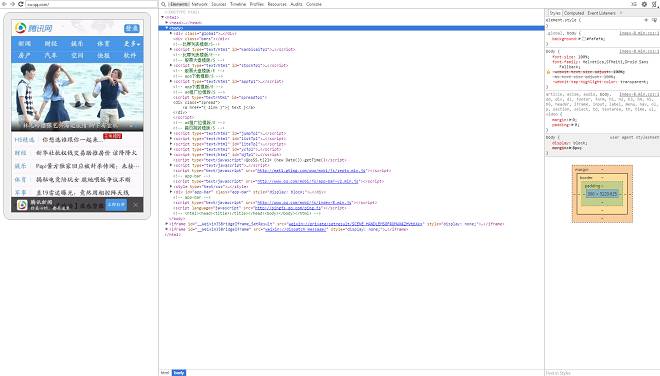
Click the "mobile phone" icon in the upper right corner of the picture above to enable the screen mapping function:
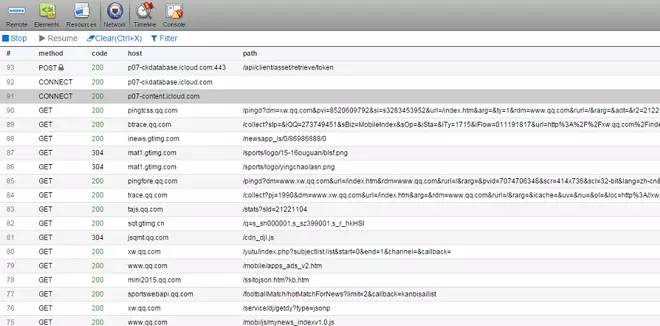
The mobile debugging function integrated with WeChat web developer tools is based on weinre and has made some improvements. Compared with using weinre directly, it has two advantages:
1. No manual work required Add the weinre debugging script to the page
2. You can see the complete http request log in the weinre network request page card, not limited to ajax requests
As shown below:
#Note that the mobile debugging function does not support https yet.
WeChat web developer tools integrate Chrome DevTools. It is consistent with the previous debugging experience on PC, and you can get started quickly.
As shown below:
3. Fix the problem of JSSDK authentication failure in some cases 4. Other experience optimizations and bug fixes
MD5: 2e054987a0dabc967a39f2f0a4949e2bWindows 32-bit version:
MD5: 956946b0c0b19532ee622d38968effbfMac version:
MD5: f078bc88cf433d0b73f4b2aded9bec65Note: Support Windows XP, win7 and above, support OS X 10.8 and above
Technical support and feedback
Email address: weixin-open@qq .comEmail subject: [WeChat web developer tool feedback]
Email content description:
1. Please describe the problem in concise language and explain clearly the scenario where the problem was encountered , you can attach a screenshot, and the WeChat team will handle your feedback as soon as possible.
2. Please attach the WeChat web developer tool log file. After closing the debugging tool, find the relevant file in the following path and send it as an email attachment:
Under windows system,
C:\Users\<User Name>\AppData\Local\WeChat Web Developer Tools\User Data\WeChat Web Developer Tools.log
Under mac system
/Users/<Username>/Library/Application Support/WeChat web developer tools/WeChat web developer tools.log


