
Home > Article > Web Front-end > Share with you 14 JavaScript data visualization libraries

This article brings you 14 JavaScript data visualization libraries. For JS developers, the ability to visualize data is as valuable as making interactive web pages. Hope it helps everyone.
JavaScript Data Visualization Libraries
We have selected 14 JavaScript libraries for data visualization ( which libraries are currently the most popular or interesting) and did some research to see which one would be the best for our project. There are many factors to consider here:
What kind of chart do I want? Pie chart, geographical chart, line chart, bar chart?
Some libraries only support a few types. First, you need to know what you need.
How big is the data set?
SVG-based libraries are generally better suited for small to medium-sized data sets, since each element is a unique node and exists in a DOM tree. This also means they allow direct access, allowing for more flexibility. While you can make them work with large data sets with the help of some data aggregation algorithms, smart memory management, and other fancy tricks, using Canvas-based tools for large data sets is a more reliable option. Canvas is very fast.
Is the app for web, mobile, or both?
Some libraries are better in terms of responsiveness, while others have their own React Native versions, such as Victory.
Does the browser support the given library?
Which JavaScript framework do you use?
Make sure your database runs smoothly. If you're using React, it's probably better to use a React-specific library than a wrapper.
What kind of look do you want?
If you need some advanced animations, this should also be taken into consideration.
In some cases, you may not need a data visualization library at all. Sometimes it's a good idea to write from scratch in native JavaScript. While it's expensive to start with (especially if it's your first time doing this), for those projects with custom custom charts, it may pay off down the road. Sometimes it's better to be sensible and spend more resources on the development part rather than trying to adapt the library to suit your specific needs. While it may sound scary at first, with an SVG-oriented mindset and a few hours of experimentation – who knows, it could be fun!
If you’re familiar with modern front-end frameworks, Vue.js is particularly good at this and working with SVG is a breeze. Note that I'm strictly talking about SVG-based charts, as it's easier to implement. The HTML5 Canvas is just a bitmap drawing surface, and it has no idea what the objects are being drawn inside - they are pixels, not DOM elements like SVG. If you want to make it interactive, you need to handle all the logic yourself. While the Canvas-based approach offers performance benefits and rigorous manipulation of large data sets (1000+ elements), I wouldn't recommend writing it from scratch - unless it's a core feature of your product.
So under what circumstances can the library be used?
When you have a weird chart in your project, a basic functionality that needs a nice interface with all the bells and whistles (tooltips, legends, X/Y axes, etc.), or when the application needs standardization, Responsive and detailed diagrams, especially when multiple types are required.
Finally, we use libraries to avoid reinventing the wheel again and again, and most libraries have been around for a long time and have most use cases in mind. Oh, and they come with built-in animation effects, too.
It is impossible to try all these libraries in a project, so here is a list I made based on my own and other people's experience. Remember, before diving into a library, it's always a good idea to figure out how to integrate it into your project. In the end, which one you choose is up to you – it’s just a list!
If you are not a large company, the options provided by open source libraries are more than enough. Add in the fact that you can answer the questions I mentioned above and it will be easy to find the perfect match.
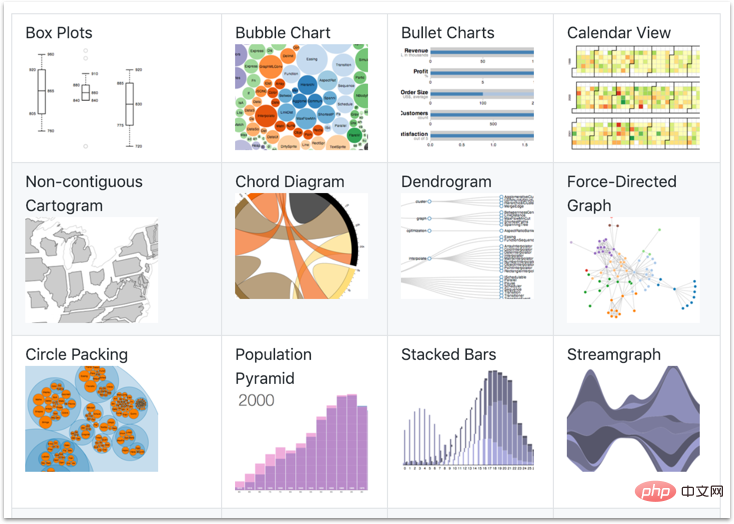
D3 is one of the most popular JS libraries, not only used for data visualization, but also Includes animation, data analysis, geography and practical applications of data. Use technologies such as HTML, SVG and CSS. It has a bunch of huge APIs, and some people think it's not a data visualization library at all. Everything you can think of can be done with this library, but it has its drawbacks, the learning curve is very steep, and the documentation is out of date, which can easily lead to confusion.
Most APIs expose direct access to the DOM, which may conflict with the way modern front-end frameworks like React or Vue work. But there are ways to solve this problem. There is a declarative data-driven document (d4 for short) that recommends letting the framework manipulate the DOM and strictly using D3 as the data API. You can find more information and examples here.
Applicable to: any environment
GitHub: https://github.com/d3
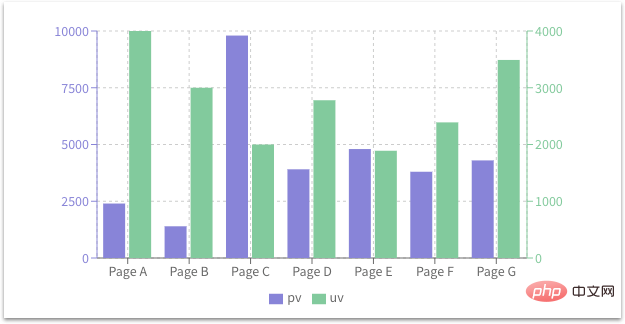
is exclusive to React. Recharts is using D3 as the engine and exports declarative components. It's very lightweight and can create beautiful interactive charts by rendering SVG elements. It's easy to use and well documented. Charts are customizable and the library itself provides some great examples. It has excellent static chart performance and includes built-in common charting tools such as legend tooltips and labels. There may be lag when working with multiple animated charts on the same page and large datasets, but it should still work for most applications.
Somewhat disturbingly there are a large number of open issues on GitHub. These questions may not be important, but the author doesn't seem very enthusiastic about answering them. So if you get stuck, be prepared to dig into the code.
Applies to: React
GitHub: https://github.com/recharts
This is a set of modular chart components designed for React and React Native. Victory does a great job with the basics - things like axis customization, labels, and passing different data sets for a single chart are all very simple, and making adjustments to style and behavior is easy and intuitive. It works really well and allows you to create beautiful charts with minimal coding. This is a cross-platform library definitely worth checking out.
Applies to: React, React Native
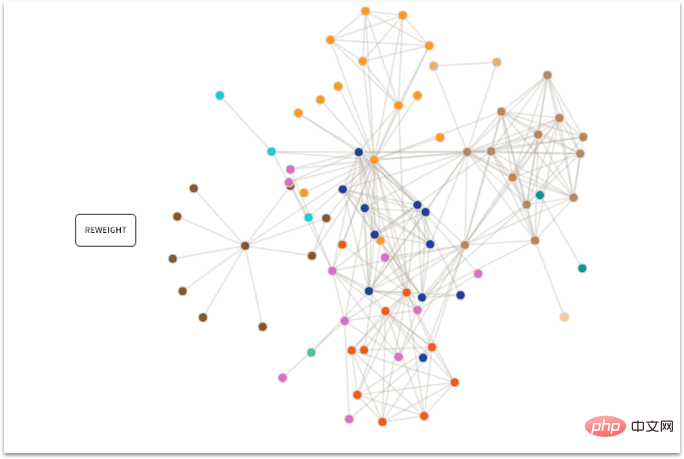
This is developed by Uber A simple visualization library that allows you to create all common chart types: bar charts, tree charts, line charts, area charts, etc. Its API is very simple and very flexible. It's lightweight and the animations are simple but smooth. It also allows writing custom charts based on existing elements.
However, its minimalist shape may not be to everyone’s taste (but I love it!). Despite the lackluster response, the documentation is simple and easy to read.
Applies to: React
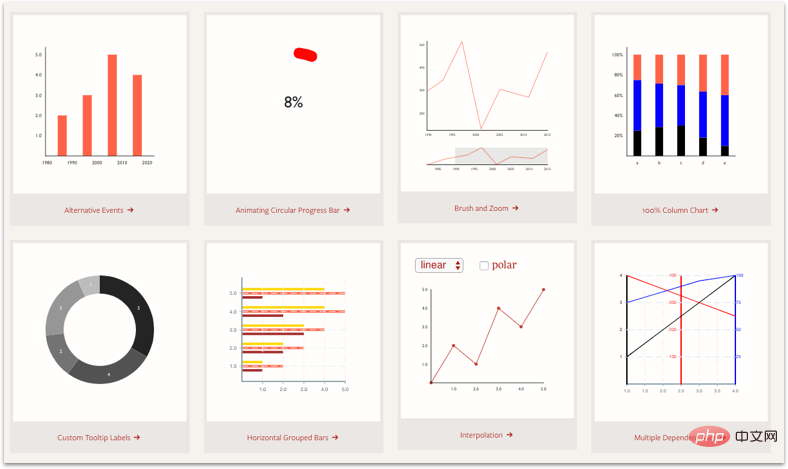
5, ApexCharts
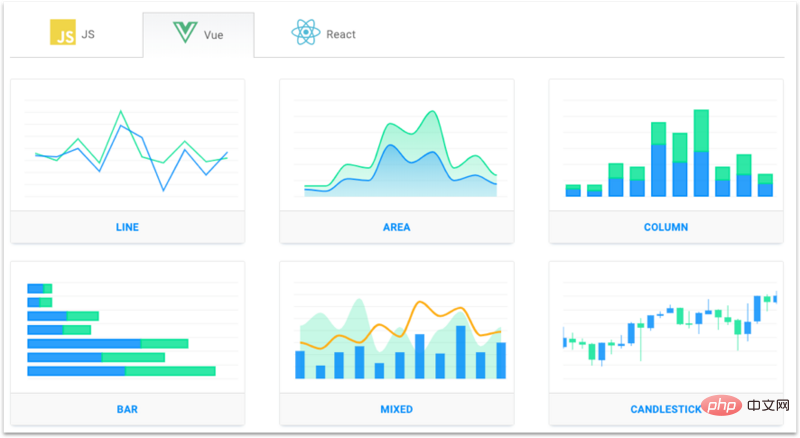
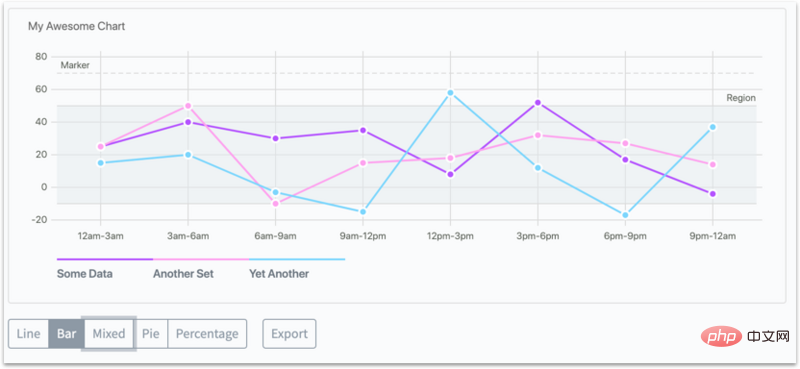
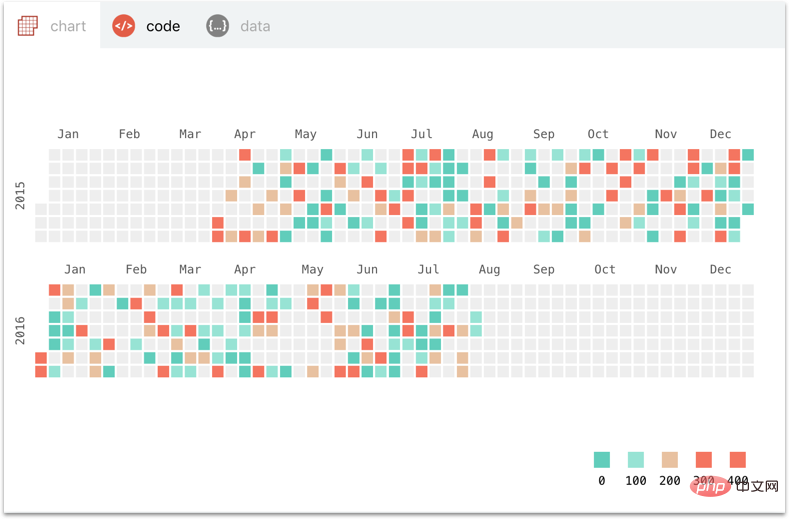
This is a very simple library for charting with zero dependencies. It is open source and has only 17 contributors, making it one of the smallest libraries on this list.
Frappe Charts was inspired by a GitHub visual effects package that supports line charts, bar charts, and other types of charts. If you are looking for a compact and lightweight bag, this is the one!
Applicable to: any environment
GitHub: https://github.com/frappe/charts
Official website: https://frappe.io/charts
Nivo is a beautiful framework based on D3 and React, providing fourteen different types of components to present your data. It was released in 2017 and launched as a product of ProductHunt on August 20, 2017.
Nivo offers many customization options and three rendering options: Canvas, SVG, and even API-based HTML. The documentation is excellent, the demo is configurable and fun. This is a high-level library, very simple, but offers little scope for custom visualizations.
Applicable to: React
GitHub: https://github.com/plouc/nivo
Official website: https://nivo.rocks/
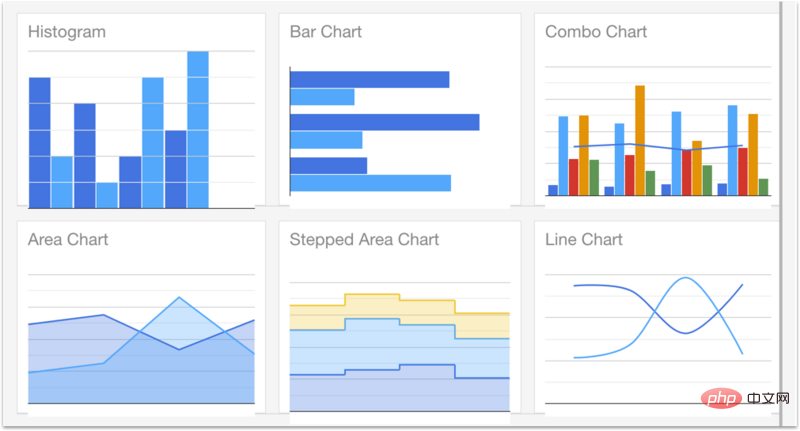
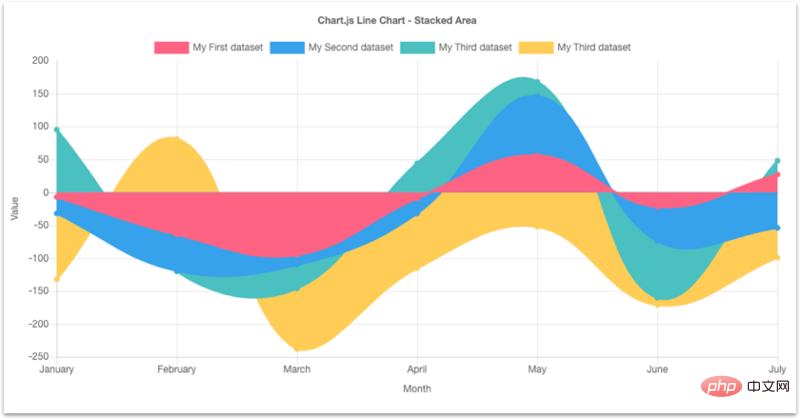
A charting web service that is so popular that I simply can’t take it off the list. It is the go-to JS library for many as it offers a variety of pre-built chart types such as bar charts, line charts, area charts, calendar charts, geography charts, and more. However, for me, in most cases, this library is a bit overkill and frankly I don't recommend using it.
It's free, but not open source (like every Google product). It's not responsive by default, but you can resize the chart using code. There are different customization options depending on the chart type, and it's not exactly suitable for beginners. And you have to load it directly from a Google URL instead of an NPM package.
Suitable for: Any environment
Some libraries offer free versions for individuals, but you need to pay to use them in commercial applications Use them. The ones listed below are commonly used by large companies. Because they are all truly comprehensive, customizable, and offer great customer support. If you are a business, you should check it out.
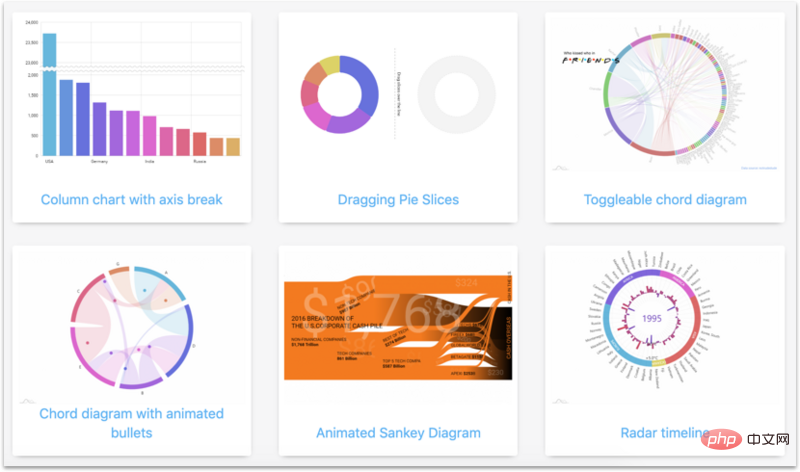
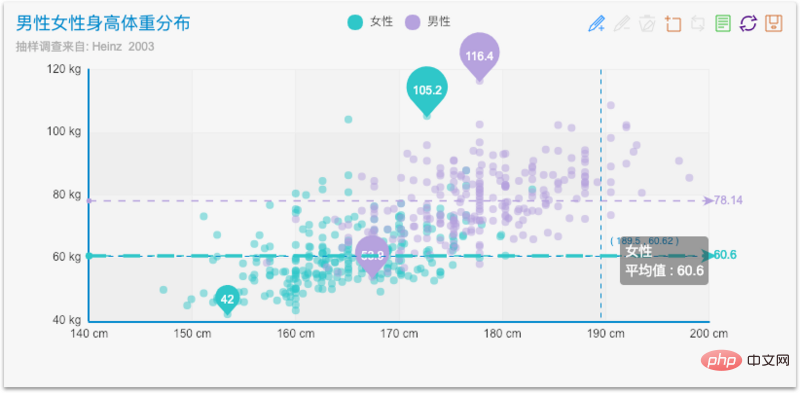
This is one of the most popular charting libraries. Its beautiful design really sets it apart from the competition. Apple, Amazon, NASA, and many well-known companies are users of amCharts, which is very impressive.
amCharts is a business tool starting at $180 per website license. In return for your investment, you get all the types of charts you need, including geographical maps, and excellent user support with an average response time of less than 3 hours. This is a great solution for large companies.
Applicable to: Angular, React, Vue.js, ordinary JS applications, TypeScript
Official website: https://www.amcharts.com/
This is another business tool that provides beautiful charts that work across devices and browsers. However, it lacks some chart types such as network charts, sparklines, and gauge charts. Plus it has a very steep learning curve.
On the other hand, it is very fast and works smoothly even with up to 100k data points. Four default themes are provided, which should suit most scenarios. Their client list is also impressive: Apple, Bosch, Siemens, HP, Microsoft, and more.
Applicable to: Angular, React, jQuery, pure JavaScript
Official website: https://canvasjs.com/
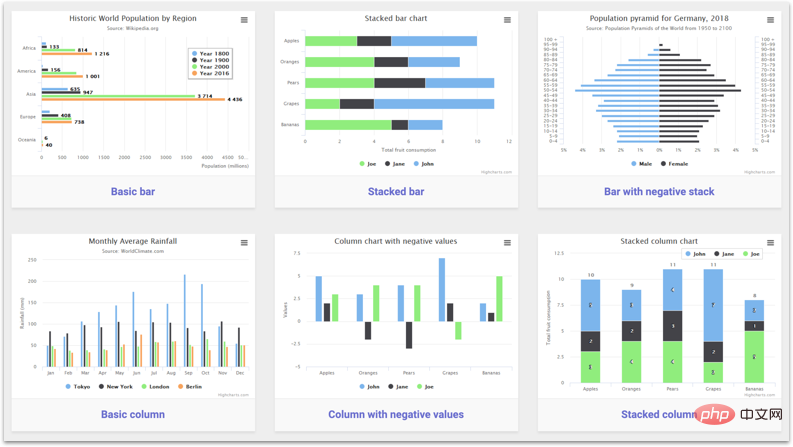
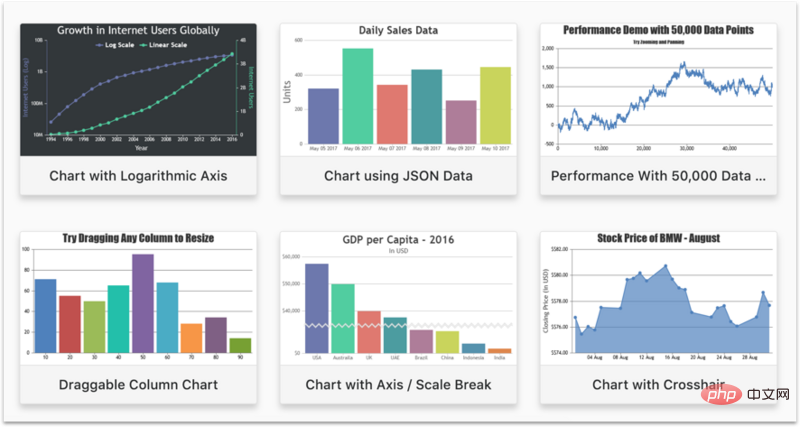
A JS library released in 2009, based on SVG, supporting VML and Canvas of older browsers. It provides different project templates. Highcharts is compatible with older browsers, including Internet Explorer 6.
This is a great solution for non-developers as it has an integrated WYSIWYG (What You See Is What You Get) diagram editor. It has a very smooth learning curve and is used by many major players like Facebook or Microsoft – some even claim that 72 of the world’s 100 largest companies have used it. This is a paid solution priced at $1500 for an unlimited commercial license.
Yet beneath the glossy exterior, it feels like it was written in 2009. A colleague of mine recently took me through it, and let me tell you, it wasn't very pleasant. It's nice to use when you're not digging down into the code layer to fiddle with it, but when you want to. . . It's a chore.
Applicable to: any environment
Official website: https://www.highcharts.com/
Another commercial JS data tool that bills itself as “the world’s most interactive JavaScript charting library.” In addition to being highly responsive, it focuses on multi-touch gestures and functionality on a variety of devices the native feel. The library prides itself on beautiful visualizations that can be easily deployed in your product with very little code.
Zoomchatrts is based on Canvas and is 20 times faster than its SVG-based competitors using default settings for the same amount of data. I couldn't find an exact price for Zoomcharts, but I found a few reviews that called it "expensive." But no matter the price, in return you get amazing interactivity, multi-touch gestures and high-quality user support.
[Related recommendations: javascript learning tutorial]
The above is the detailed content of Share with you 14 JavaScript data visualization libraries. For more information, please follow other related articles on the PHP Chinese website!