
Home > Article > Web Front-end > How to debug using Console
This time I will show you how to debug using Console, and what are the precautions for using Console to debug. The following is a practical case, let’s take a look.
Preface
Over the past ten years, one of my biggest passions has been front-end development (especially Yes, we all know the following basic skills:console.log(‘Hello World!'); console.info(‘Something happened…'); console.warn(‘Something strange happened…'); console.error(‘Something horrible happened…');From now on, I will teach you some skills you don’t know and let you become an experienced driver!
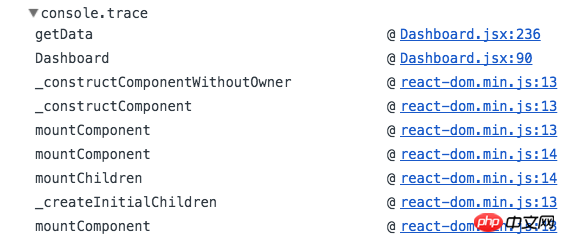
1. console.trace()
If you want to know where the message is printed, useconsole.trace( ) to get the stacktrace of the data to be printed.
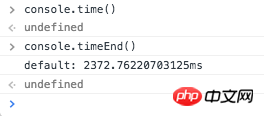
2. console.time() && console.timeEnd()
If you want to analyze For function performance, you can useconsole.time() to time and console.timeEnd() to end the time. The console will print out the time difference between the two times.
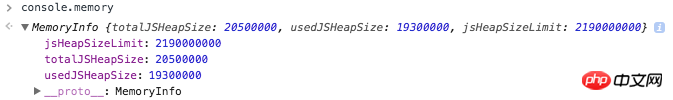
3. console.memory
If you find performance issues difficult to analyze, you may also To consider whether there is a memory leak, you can useconsole.memory (note that memory is a property of the console, not a function) to check the current heap usage.
4. console.profile('profileName') & console.profileEnd('profileName')
Although not a standard approach, it is widely accepted and used. You can use these two commands to start and stop profiling. This helps you do accurate profiling in your code. Rather than relying on manual mouse clicks. You can find the profile just now in the browser console JavaScript Profiler.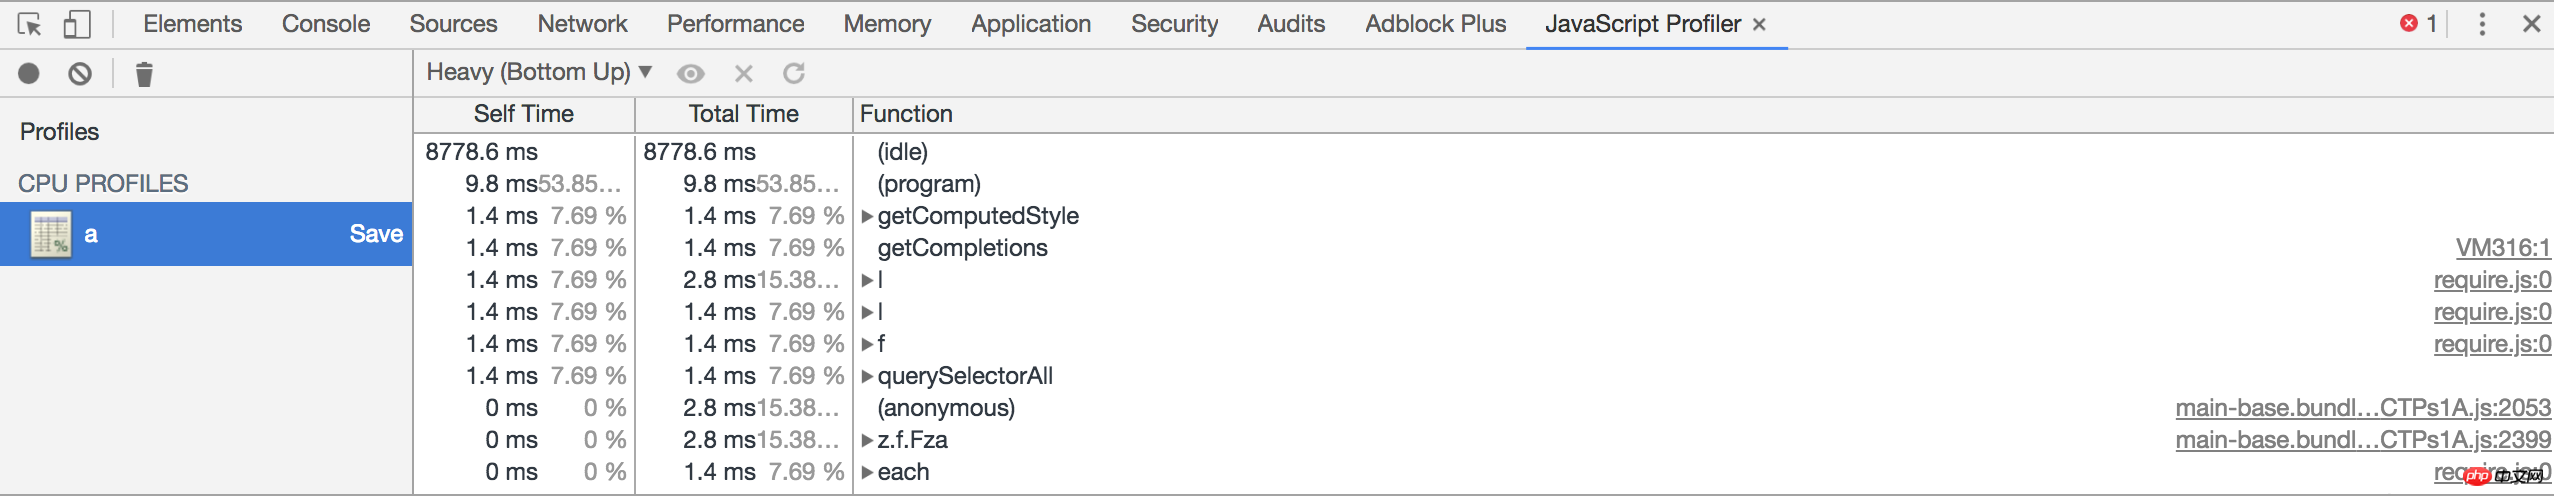
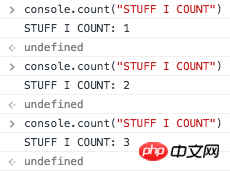
5. console.count(“STUFF I COUNT”)
Sometimes in order to record a How many times a function or a piece of code has been executed repeatedly can be recorded usingconsole.count('?'). Every time this code is executed, it will automatically increase by 1.
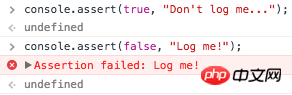
6. console.assert(false, “Log me!”)
You can useconsole.assertTo output messages under certain false conditions instead of using if-else.
Note: will report an error (Assertion Error) under Node.js.
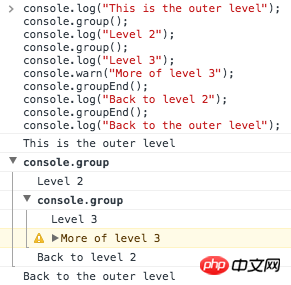
7. console.group('group') & console.groupEnd('group')
If you want to format the printed log, you can useconsole.group() and console.groupEnd() . Use console.group to aggregate logs into groups and form nested hierarchies.
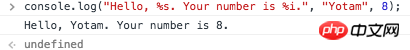
8. String substitutions
You can use console.log to print variables(%s = string, %i = integer, %o = object, %f = float).
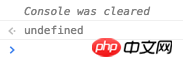
9. console.clear()
We have output a lot of records on the console, Use console.clear() to clear it.
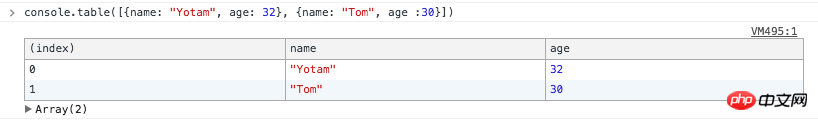
10. console.table()
The last one! You can use console.table() to print the object in table form.
# I believe you have mastered the method after reading the case in this article. For more exciting information, please pay attention to other related articles on the php Chinese website!
Recommended reading:
Detailed explanation of the steps to globally introduce bass.scss into Vue
The above is the detailed content of How to debug using Console. For more information, please follow other related articles on the PHP Chinese website!