Home >Web Front-end >JS Tutorial >Example of echarts setting polyline line color and polyline point color
This article mainly introduces the method of jQuery plug-in echarts to set the color of polyline lines and polyline points in the line chart. It analyzes the related operation skills of jQuery plug-in echarts to set the line chart in the form of examples. Friends who need it can refer to it. I hope it can Help everyone.
1. Problem background
Design a line chart, but the graphics does not use the colors that come with the plug-in. You need to customize the colors of the lines and vertices
2. Implement source code
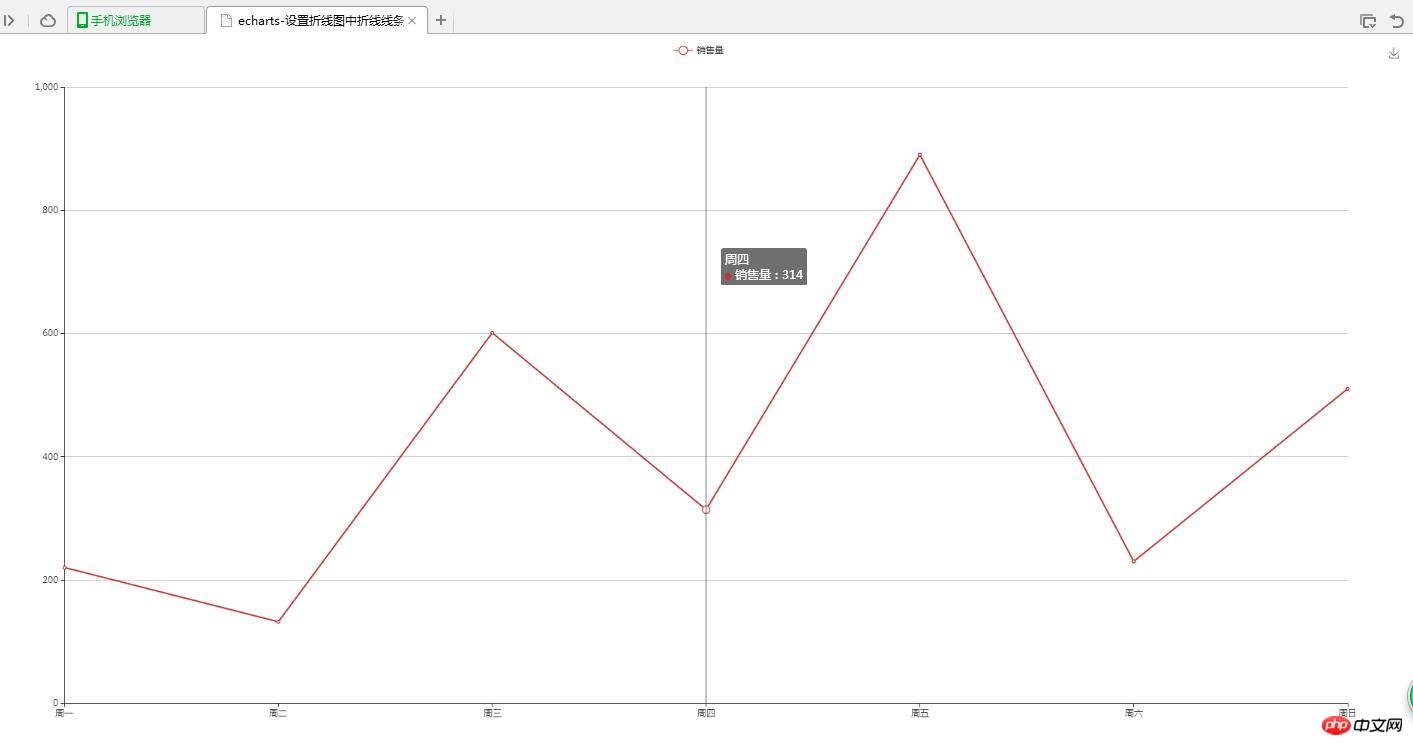
(1) Graphics self-assigned color
<!DOCTYPE html>
<html>
<head>
<meta charset="UTF-8">
<title>echarts-设置折线图中折线线条颜色和折线点颜色</title>
<link rel="shortcut icon" href="../js/echarts-2.2.7/doc/asset/ico/favicon.png" rel="external nofollow" rel="external nofollow" rel="external nofollow" >
<script type="text/javascript" src="../js/echarts-2.2.7/doc/asset/js/jquery.min.js" ></script>
<script type="text/javascript" src="../js/echarts-2.2.7/doc/example/www2/js/echarts-all.js" ></script>
<style>
body,html{
width: 99%;
height: 99%;
font-family: "微软雅黑";
font-size: 12px;
}
#line{
width: 100%;
height: 100%;
}
</style>
<script>
$(function(){
var chart = document.getElementById('line');
var echart = echarts.init(chart);
var option = {
title: {
text: ''
},
tooltip: {
trigger: 'axis'
},
legend: {
data:['销售量']
},
grid: {
left: '3%',
right: '4%',
bottom: '3%',
containLabel: true
},
toolbox: {
feature: {
saveAsImage: {}
}
},
xAxis: {
type: 'category',
boundaryGap: false,
data: ['周一','周二','周三','周四','周五','周六','周日']
},
yAxis: {
type: 'value'
},
series: [
{
name:'销售量',
type:'line',
stack: '销售量',
data:[220, 132, 601, 314, 890, 230, 510]
}
]
};
echart.setOption(option);
});
</script>
</head>
<body>
<p id="line"></p>
</body>
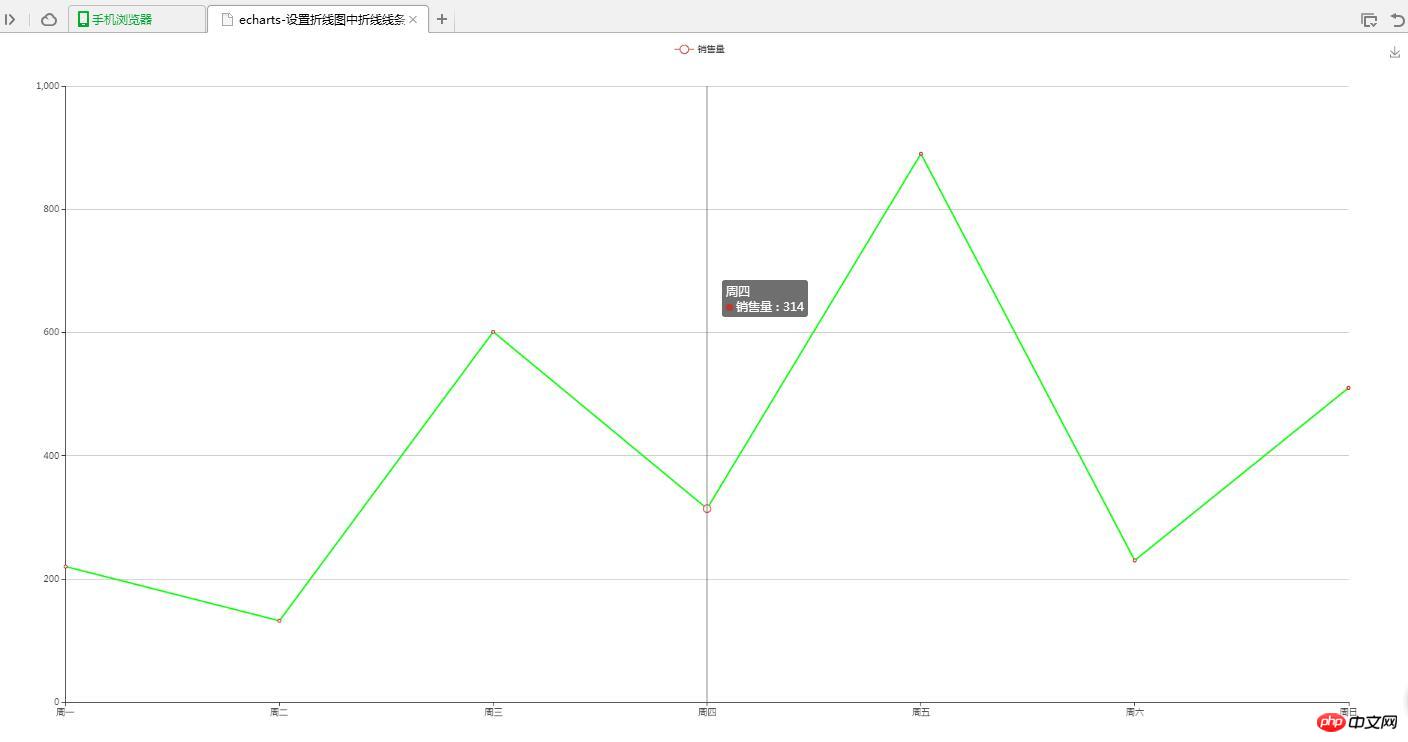
</html>(2) Line custom color
<!DOCTYPE html>
<html>
<head>
<meta charset="UTF-8">
<title>echarts-设置折线图中折线线条颜色和折线点颜色</title>
<link rel="shortcut icon" href="../js/echarts-2.2.7/doc/asset/ico/favicon.png" rel="external nofollow" rel="external nofollow" rel="external nofollow" >
<script type="text/javascript" src="../js/echarts-2.2.7/doc/asset/js/jquery.min.js" ></script>
<script type="text/javascript" src="../js/echarts-2.2.7/doc/example/www2/js/echarts-all.js" ></script>
<style>
body,html{
width: 99%;
height: 99%;
font-family: "微软雅黑";
font-size: 12px;
}
#line{
width: 100%;
height: 100%;
}
</style>
<script>
$(function(){
var chart = document.getElementById('line');
var echart = echarts.init(chart);
var option = {
title: {
text: ''
},
tooltip: {
trigger: 'axis'
},
legend: {
data:['销售量']
},
grid: {
left: '3%',
right: '4%',
bottom: '3%',
containLabel: true
},
toolbox: {
feature: {
saveAsImage: {}
}
},
xAxis: {
type: 'category',
boundaryGap: false,
data: ['周一','周二','周三','周四','周五','周六','周日']
},
yAxis: {
type: 'value'
},
series: [
{
name:'销售量',
type:'line',
stack: '销售量',
itemStyle : {
normal : {
lineStyle:{
 color:'#00FF00'
}
}
},
data:[220, 132, 601, 314, 890, 230, 510]
}
]
};
echart.setOption(option);
});
</script>
</head>
<body>
<p id="line"></p>
</body>
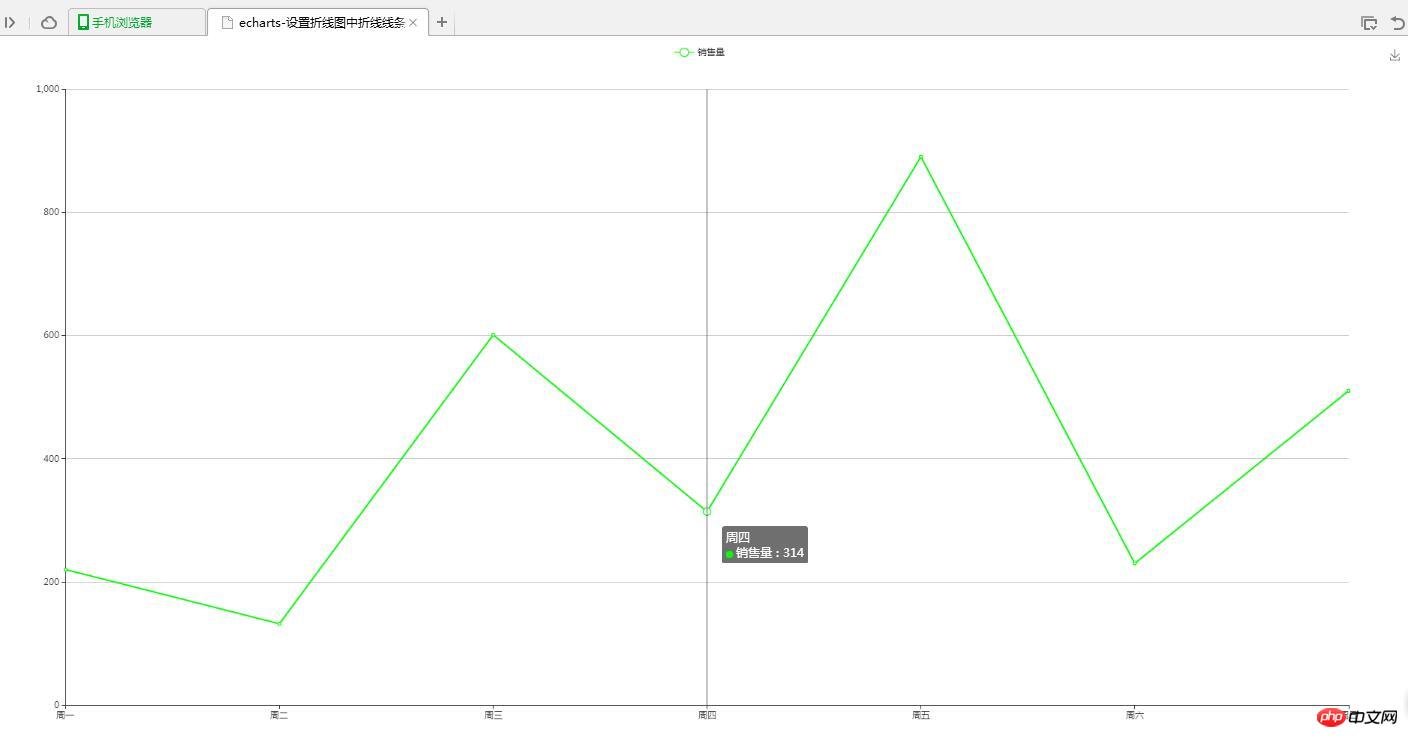
</html>(3) Folding Click Custom Color
<!DOCTYPE html>
<html>
<head>
<meta charset="UTF-8">
<title>echarts-设置折线图中折线线条颜色和折线点颜色</title>
<link rel="shortcut icon" href="../js/echarts-2.2.7/doc/asset/ico/favicon.png" rel="external nofollow" rel="external nofollow" rel="external nofollow" >
<script type="text/javascript" src="../js/echarts-2.2.7/doc/asset/js/jquery.min.js" ></script>
<script type="text/javascript" src="../js/echarts-2.2.7/doc/example/www2/js/echarts-all.js" ></script>
<style>
body,html{
width: 99%;
height: 99%;
font-family: "微软雅黑";
font-size: 12px;
}
#line{
width: 100%;
height: 100%;
}
</style>
<script>
$(function(){
var chart = document.getElementById('line');
var echart = echarts.init(chart);
var option = {
title: {
text: ''
},
tooltip: {
trigger: 'axis'
},
legend: {
data:['销售量']
},
grid: {
left: '3%',
right: '4%',
bottom: '3%',
containLabel: true
},
toolbox: {
feature: {
saveAsImage: {}
}
},
xAxis: {
type: 'category',
boundaryGap: false,
data: ['周一','周二','周三','周四','周五','周六','周日']
},
yAxis: {
type: 'value'
},
series: [
{
name:'销售量',
type:'line',
stack: '销售量',
itemStyle : {
normal : {
color:'#00FF00',
lineStyle:{
color:'#00FF00'
}
}
},
data:[220, 132, 601, 314, 890, 230, 510]
}
]
};
echart.setOption(option);
});
</script>
</head>
<body>
<p id="line"></p>
</body>
</html>3. Realize the result
(1) Graphics self-assign color

( 2) Line custom color

(3) Vertex custom color

4. Question Instructions
(1) Set the polyline line color
lineStyle:{
color:'#00FF00'
}(2) Set the polyline vertex color
itemStyle : {
 normal : {
  color:'#00FF00'
 }
}
Related recommendations:
The above is the detailed content of Example of echarts setting polyline line color and polyline point color. For more information, please follow other related articles on the PHP Chinese website!