
Home > Article > Web Front-end > Detailed explanation of the usage of jQuery plug-in echarts to remove vertical grid lines

This article mainly introduces the usage of jQuery plug-in echarts to remove vertical grid lines, and compares and analyzes the jQuery icon plug-in echarts' related setting and operation skills for vertical grid lines in the form of examples. Friends who need it can refer to it. I hope it can help everyone. .
1. Problem background
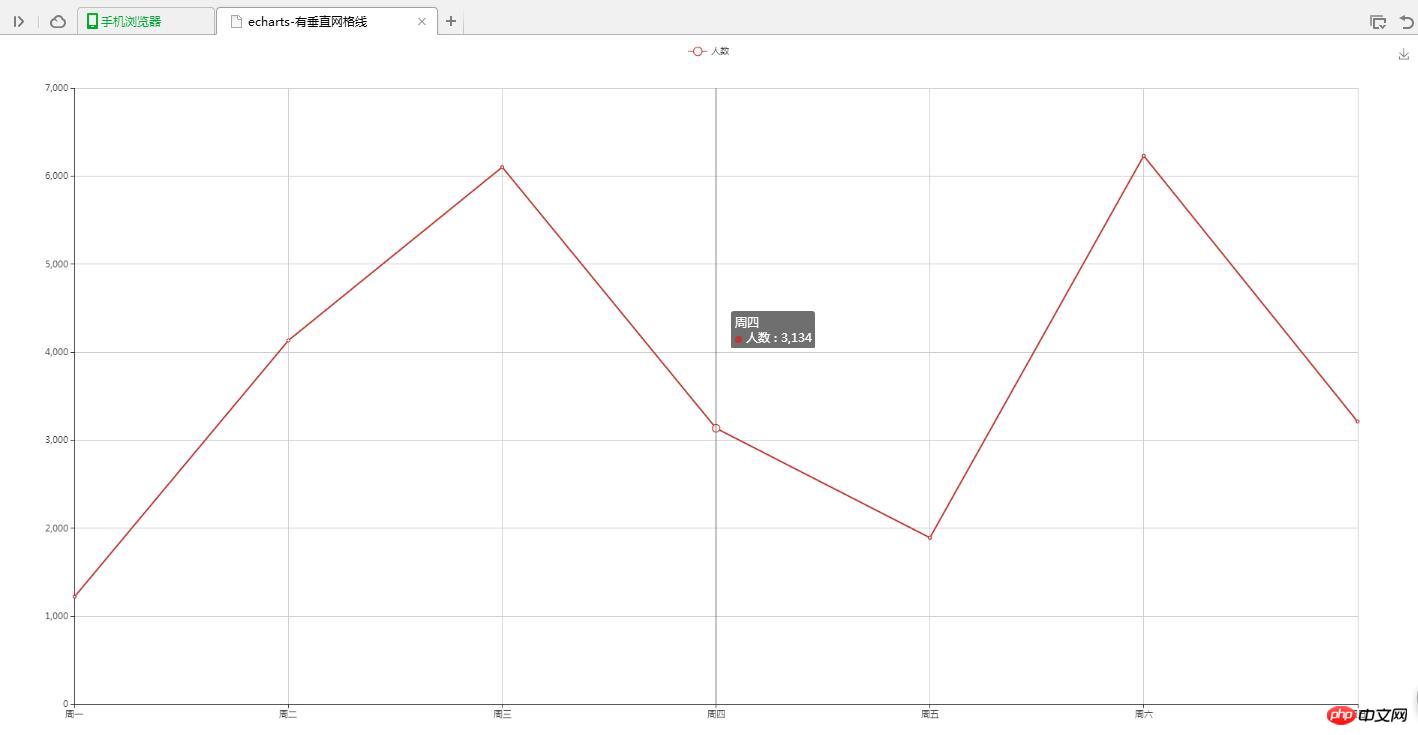
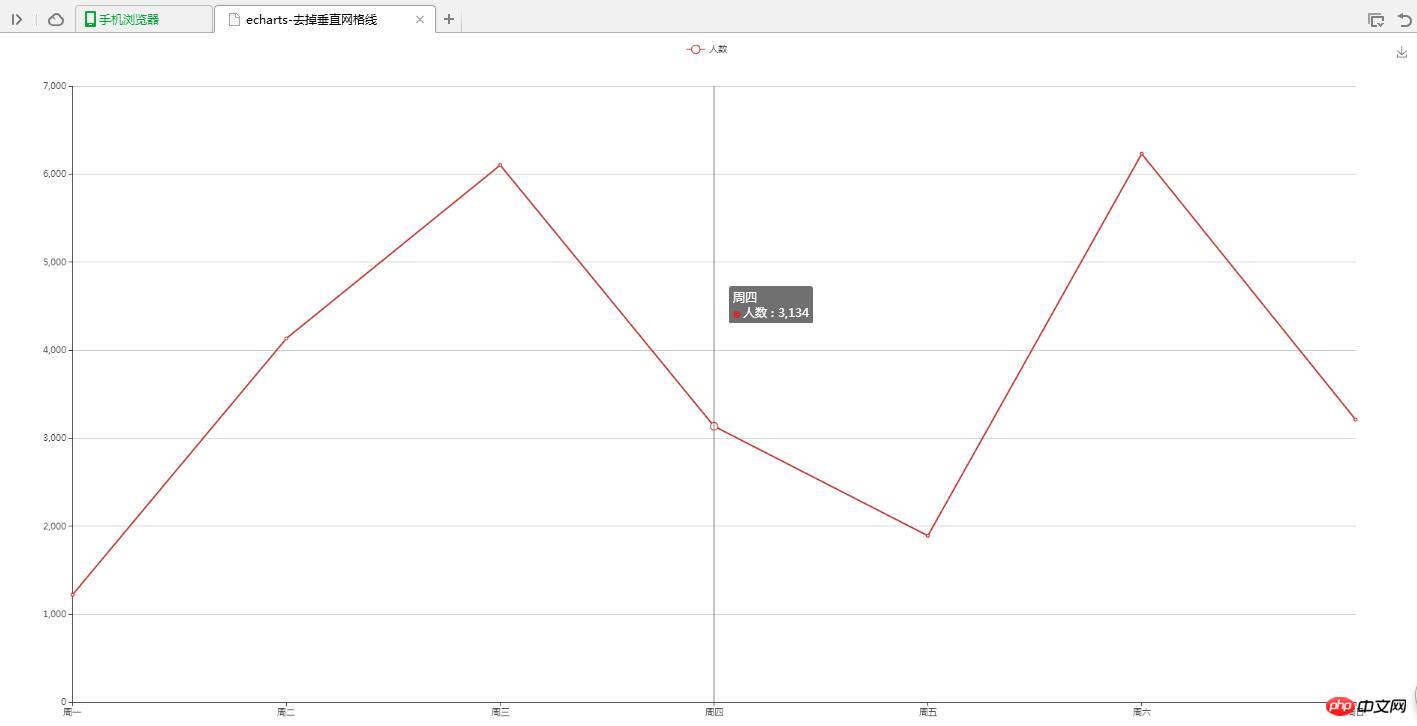
Design a polyline for counting people, in which the grid line has no vertical lines
2. Implementation source code
(1) With vertical grid lines
<!DOCTYPE html>
<html>
<head>
<meta charset="UTF-8">
<title>echarts-有垂直网格线</title>
<link rel="shortcut icon" href="../js/echarts-2.2.7/doc/asset/ico/favicon.png" rel="external nofollow" rel="external nofollow" >
<script type="text/javascript" src="../js/echarts-2.2.7/doc/asset/js/jquery.min.js" ></script>
<script type="text/javascript" src="../js/echarts-2.2.7/doc/example/www2/js/echarts-all.js" ></script>
<style>
body,html{
width: 99%;
height: 99%;
font-family: "微软雅黑";
font-size: 12px;
}
#chart{
width: 100%;
height: 100%;
}
</style>
<script>
$(function(){
var chart = document.getElementById('chart');
var echart = echarts.init(chart);
var option = {
title: {
text: ''
},
tooltip: {
trigger: 'axis'
},
legend: {
data:['人数']
},
grid: {
left: '3%',
right: '4%',
bottom: '3%',
containLabel: true
},
toolbox: {
feature: {
saveAsImage: {}
}
},
xAxis: {
type: 'category',
boundaryGap: false,
splitLine:{
show:true
},
data: ['周一','周二','周三','周四','周五','周六','周日']
},
yAxis: {
type: 'value'
},
series: [
{
name:'人数',
type:'line',
stack: '人数',
data:[1220, 4132, 6101, 3134, 1890, 6230, 3210]
}
]
};
echart.setOption(option);
});
</script>
</head>
<body>
<p id="chart"></p>
</body>
</html>(2) Without vertical grid lines
<!DOCTYPE html>
<html>
<head>
<meta charset="UTF-8">
<title>echarts-去掉垂直网格线</title>
<link rel="shortcut icon" href="../js/echarts-2.2.7/doc/asset/ico/favicon.png" rel="external nofollow" rel="external nofollow" >
<script type="text/javascript" src="../js/echarts-2.2.7/doc/asset/js/jquery.min.js" ></script>
<script type="text/javascript" src="../js/echarts-2.2.7/doc/example/www2/js/echarts-all.js" ></script>
<style>
body,html{
width: 99%;
height: 99%;
font-family: "微软雅黑";
font-size: 12px;
}
#chart{
width: 100%;
height: 100%;
}
</style>
<script>
$(function(){
var chart = document.getElementById('chart');
var echart = echarts.init(chart);
var option = {
title: {
text: ''
},
tooltip: {
trigger: 'axis'
},
legend: {
data:['人数']
},
grid: {
left: '3%',
right: '4%',
bottom: '3%',
containLabel: true
},
toolbox: {
feature: {
saveAsImage: {}
}
},
xAxis: {
type: 'category',
boundaryGap: false,
splitLine:{
show:false
},
data: ['周一','周二','周三','周四','周五','周六','周日']
},
yAxis: {
type: 'value'
},
series: [
{
name:'人数',
type:'line',
stack: '人数',
data:[1220, 4132, 6101, 3134, 1890, 6230, 3210]
}
]
};
echart.setOption(option);
});
</script>
</head>
<body>
<p id="chart"></p>
</body>
</html>3. Implementation results
(1) There are vertical grid lines
(2) No vertical grid lines
4. Problem description
To remove the vertical lines in the grid, just add the splitLine attribute setting to xAxisshow:false
Related recommendations:
Sharing of examples of loop generation chart effects implemented by echarts
Detailed explanation of the use of adding Echarts charts in vue
PHP uses Echarts to generate data statistics Report details
The above is the detailed content of Detailed explanation of the usage of jQuery plug-in echarts to remove vertical grid lines. For more information, please follow other related articles on the PHP Chinese website!