
Home > Article > Web Front-end > Detailed explanation of the correct posture for using Echarts in React components

This article mainly introduces the sample code for using Echarts in React components. The editor thinks it is quite good, so I will share it with you now and give it as a reference. Let’s follow the editor to take a look, I hope it can help everyone.
When completing a requirement, you encounter a scenario where you need to use a histogram. When it comes to visualization, the first reaction is of course Echarts. It is usually very convenient to load Echarts components with js, but it takes a lot of effort in React. All kinds of guessing came true.
in edmo Here we want to use ECharts in the react project we built. We can see on the ECharts official website that there is a way to use ECharts in webpack. This is the method we need.
We must install ECharts before using ECharts. In the past development model, many of our uses were to import the core js files of ECharts on the official website into our html or jsp files, but in In the react project, we can directly use the npm command of node.js to install:
npm install echarts --save
The example of Echarts is the simplest application introduced in the Echarts document.
render:function() {

  var info = 1;

    return (


    )
  }
This is where the Echarts component is called, and 2 attributes are passed to it (the beginning of data- is the specification defined by H5)
var Chart = React.createClass({
  getInitialState: function() {
    this.token = Store.addListener(this.onChangeData);
    return {}
  },

  componentWillMount: function() {
    var info = this.props.data;
    //HTML5规定自定义属性要以data-开头,这样的可以如下取
    console.log(this.props['data-info'])
    Action.getInfo(info);
  },


   componentDidUpdate: function() {
     this.showChart(this.state.data)
   },

   onChangeData: function() {
    var data = Store.getData();
    this.setState({
      data: data['info']['data'] //后台返回的数据
    });
  },

   showChart: function(dataSet){
    var myChart = echarts.init(document.getElementById('main'));

    var option = {
        title: {
        text: 'ECharts 入门示例'
      },
      color: ['#3398DB'],
      tooltip : {
        trigger: 'axis',
        axisPointer : {
          type : 'shadow'
        }
      },
      grid: {
        left: '3%',
        right: '4%',
        bottom: '3%',
        containLabel: true
      },
      xAxis : [
        {
          type : 'category',
          data : ['Mon', 'Tue', 'Wed', 'Thu', 'Fri', 'Sat', 'Sun'],
          axisTick: {
            alignWithLabel: true
          }
        }
      ],
      yAxis : [
        {
          type : 'value'
        }
      ],
      series : [
        {
          name:'你好',
          type:'bar',
          barWidth: '60%',
          data: dataSet
        }
      ]
    };

    myChart.setOption(option);
   },

   render: function() {
    return (

    )
  }
});
The above is the complete code of the demo Echarts component, mainly It uses the processing functions (a total of 5 types) provided by React according to different states (3 states).
1. componentWillMount: Initiate Action before inserting the real DOM and request data from the backend.
2. onChangeStore: Update the data when the data changes, and add a listener for monitoring data changes in the Store to getInitialState.
3. componentDidUpdate: After the data is re-rendered, trigger the showChart() method to draw the canvas.
4. showChart: Configure Echarts. For specific configuration information, please refer to the Echarts document
5. If the component life cycle ends, add the following code:
  componentWillUnmount: function() {
    this.token.remove();
  },
Otherwise it will Error: Warning: setState(...): Can only update a mounted or mounting component. This usually means you called setState() on an unmounted component. This is a no-op. Please check the code for the undefined component.
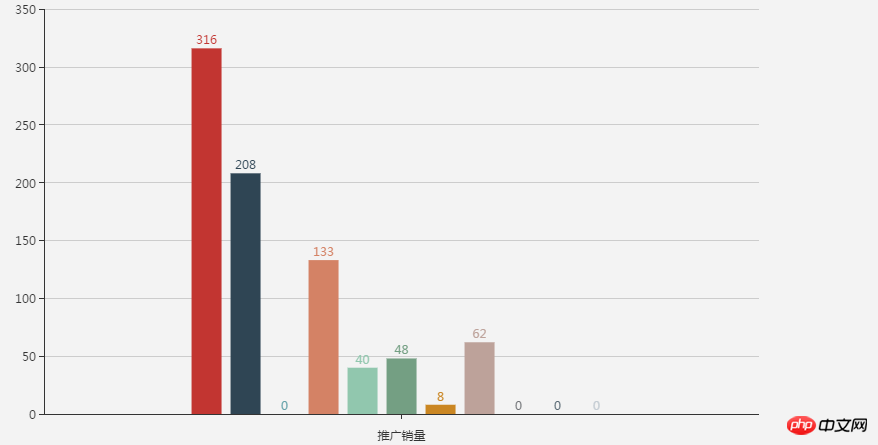
Finally attached is the rendering:
 Related recommendations:
Detailed introduction to Echarts usage
ECharts- Detailed graphic and text explanation of JavaScript chart library based on HTML5 Canvas
ECharts3 implements the operation of dynamic data + time axis
The above is the detailed content of Detailed explanation of the correct posture for using Echarts in React components. For more information, please follow other related articles on the PHP Chinese website!