
Home > Article > Web Front-end > Front-end advancement (6): Observe function call stack, scope chain and closure


The accompanying pictures have nothing to do with this article
In front-end development, there is a very important skill called BreakpointDebugging.
In chrome's developer tools, through breakpoint debugging, we can very conveniently observe the execution process of JavaScript step by step and intuitively perceiveFunctionCall stack, scope chain, VariablesObject, closure, this and other key information changes. Therefore, breakpoint debugging plays a very important role in quickly locating code errors and quickly understanding the execution process of the code. This is also an essential advanced skill for our front-end developers.
Of course, if you don’t know enough about these basic concepts of JavaScript [execution context, variable objects, closures, this, etc.], it may be difficult to thoroughly master breakpoint debugging. But fortunately, in the previous articles, I have given a detailed overview of these concepts, so it should be relatively easy for everyone to master this skill.
In order to help everyone have a better understanding of this and closure, and because the definition of closure in the previous article is a bit biased, I will use closure in this article. Use examples to learn breakpoint debugging so that everyone can make corrections in time. I admit my mistake here, I misled everyone, please forgive me~~
When a function is called for execution, it will create an execution context for the current function. . During the creation phase of the execution context, the variable object, scope chain, closure, and this pointer will be determined respectively. Generally speaking, there are multiple functions in a JavaScript program. The JavaScript engine uses the function call stack to manage the calling order of these functions. The calling sequence of the function call stack is consistent with the stack data structure.
In the latest version of the chrome browser (I am not sure the old version you are using is the same as mine), call up the developer of the chrome browser tool.
浏览器右上角竖着的三点 -> 更多工具 -> 开发者工具 -> Sources
The interface is as shown.
Breakpoint debugging interface
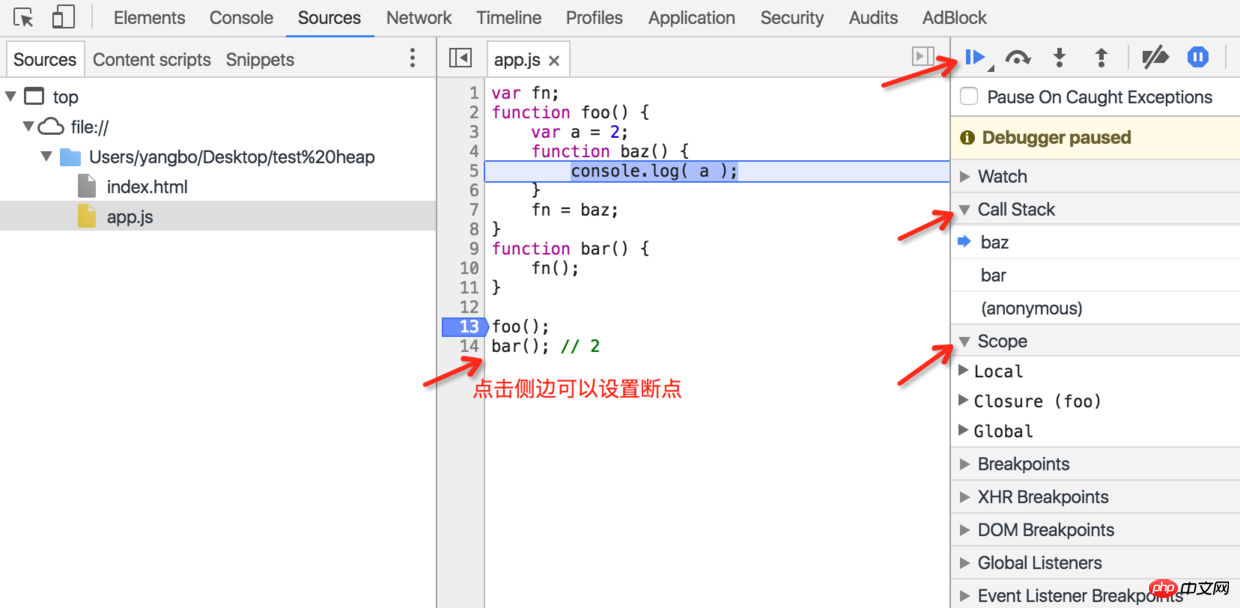
In my demo, I put the code in app.js, Introduced in index.html. For now, we only need to focus on the red arrow in the screenshot. Above the far right, there is a row of icons. We can control the execution order of functions by using them. From left to right they are:
resume/pause script execution
Resume/pause script execution
step over next function call
Crossed over, the actual performance is that when no function is encountered, the next step is executed. When a function is encountered, the next step is executed directly without entering the function.
step into next function call
Step into, the actual performance is that when the function is not encountered, the next step is executed. When a function is encountered, the function execution context is entered.
step out of current function
Step out of the current function
deactivate breakpoints
Disable breakpoints
don't pause on exceptions
Do not pause exception capture
Among them, crossing over, stepping into, and jumping out are the three operations I use most.
The second red arrow on the right side of the above picture points to the function call stack (call Stack). The changes in the call stack during code execution are displayed here.
The third red arrow on the right points to the scope chain (Scope), where the scope chain of the current function will be displayed. Where Local represents the current local variable object, and Closure represents the closure in the current scope chain. With the help of the scope chain display here, we can intuitively determine who is the closure in an example, which is very helpful for an in-depth understanding of closures.
Click where the number of lines of code is displayed to set a breakpoint. Breakpoint settings have the following characteristics:
Breakpoints cannot be set on the line where a separate variable is declared (if no value is assigned) or a function is declared.
After setting a breakpoint and refreshing the page, the JavaScript code will be executed to the breakpoint location and paused. Then we can start debugging using the operations introduced above.
当你设置多个断点时,chrome工具会自动判断从最早执行的那个断点开始执行,因此我一般都是设置一个断点就行了。
接下来,我们借助一些实例,来使用断点调试工具,看一看,我们的demo函数,在执行过程中的具体表现。
// demo01

var fn;
function foo() {
    var a = 2;
    function baz() {
        console.log( a );
    }
    fn = baz;
}
function bar() {
    fn();
}

foo();
bar(); // 2
在向下阅读之前,我们可以停下来思考一下,这个例子中,谁是闭包?
这是来自《你不知道的js》中的一个例子。由于在使用断点调试过程中,发现chrome浏览器理解的闭包与该例子中所理解的闭包不太一致,因此专门挑出来,供大家参考。我个人更加倾向于chrome中的理解。
第一步:设置断点,然后刷新页面。
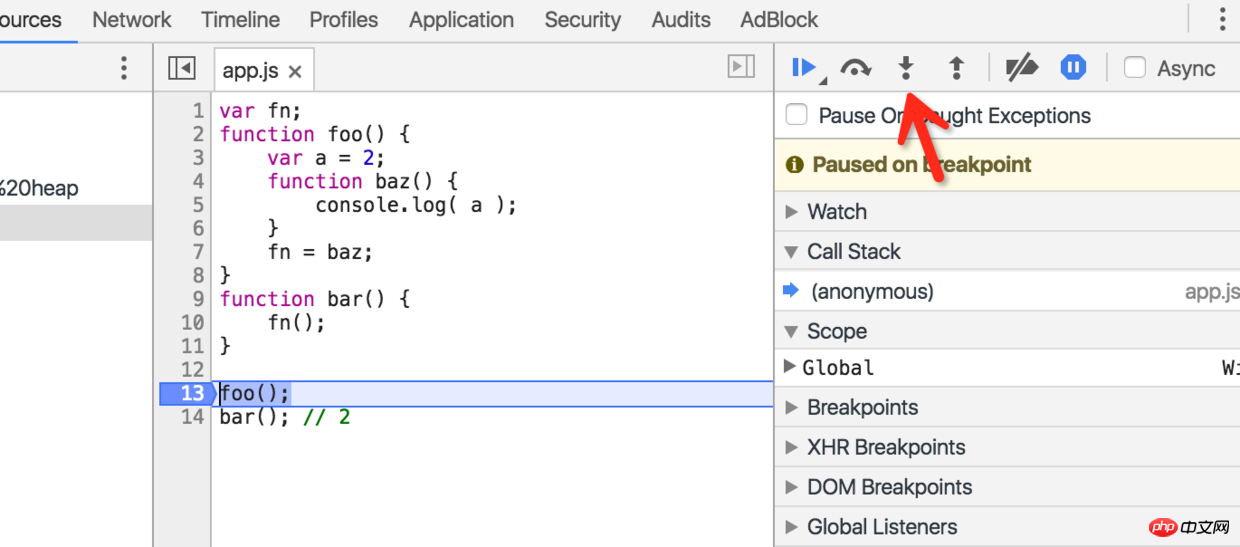
设置断点
第二步:点击上图红色箭头指向的按钮(step into),该按钮的作用会根据代码执行顺序,一步一步向下执行。在点击的过程中,我们要注意观察下方call stack 与 scope的变化,以及函数执行位置的变化。
一步一步执行,当函数执行到上例子中
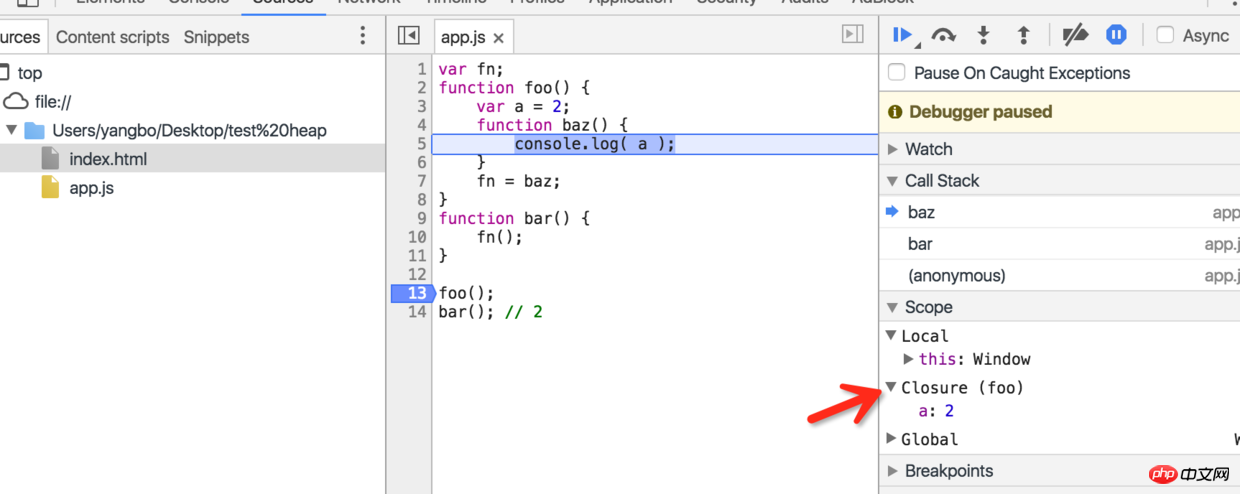
baz函数被调用执行,foo形成了闭包
我们可以看到,在chrome工具的理解中,由于在foo内部声明的baz函数在调用时访问了它的变量a,因此foo成为了闭包。这好像和我们学习到的知识不太一样。我们来看看在《你不知道的js》这本书中的例子中的理解。
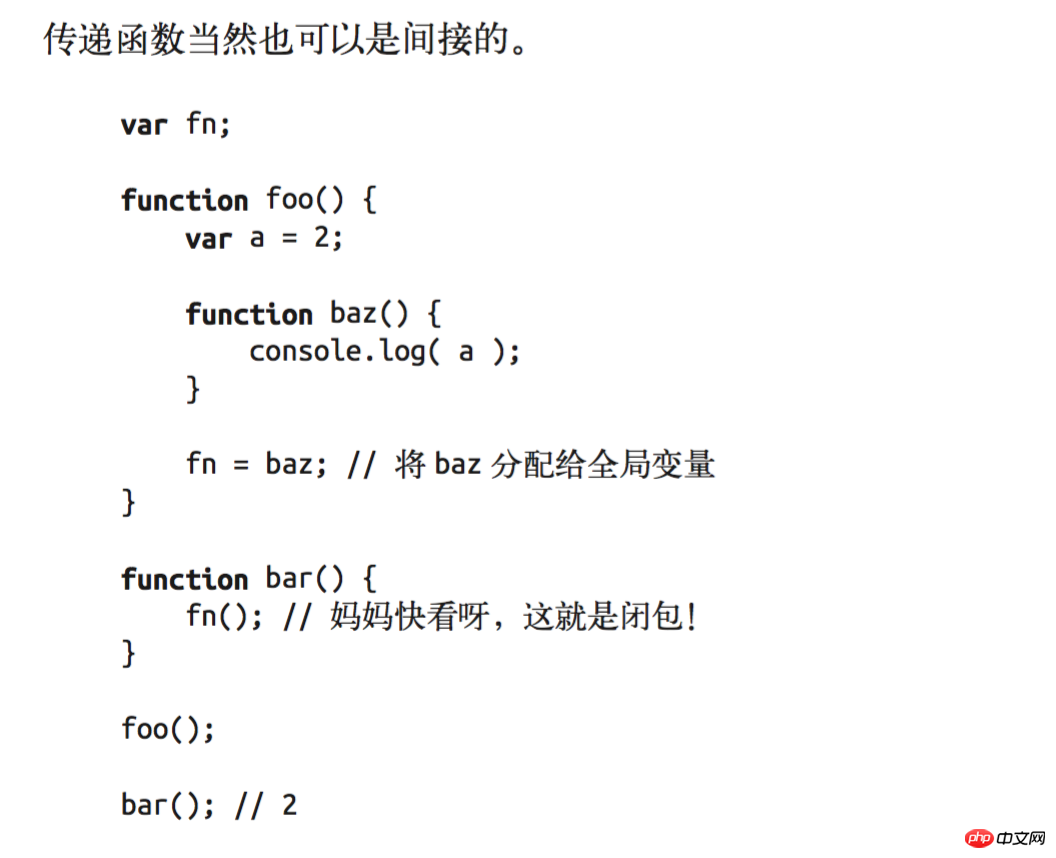
你不知道的js中的例子
书中的注释可以明显的看出,作者认为fn为闭包。即baz,这和chrome工具中明显是不一样的。
而在备受大家推崇的《JavaScript高级编程》一书中,是这样定义闭包。
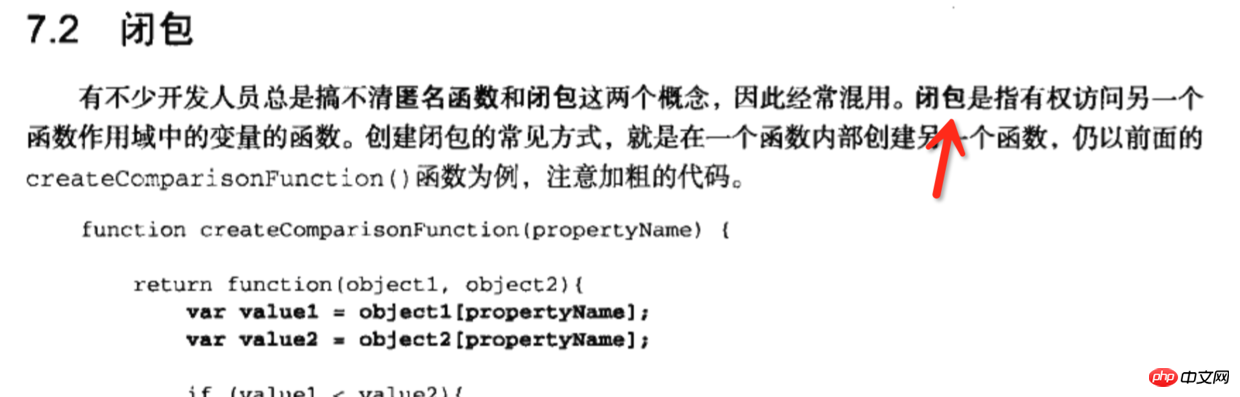
JavaScript高级编程中闭包的定义
书中作者将自己理解的闭包与包含函数所区分
这里chrome中理解的闭包,与我所阅读的这几本书中的理解的闭包不一样。具体这里我先不下结论,但是我心中更加偏向于相信chrome浏览器。
我们修改一下demo01中的例子,来看看一个非常有意思的变化。
// demo02
var fn;
var m = 20;
function foo() {
    var a = 2;
    function baz(a) {
        console.log(a);
    }
    fn = baz;
}
function bar() {
    fn(m);
}

foo();
bar(); // 20
这个例子在demo01的基础上,我在baz函数中传入一个参数,并打印出来。在调用时,我将全局的变量m传入。输出结果变为20。在使用断点调试看看作用域链。
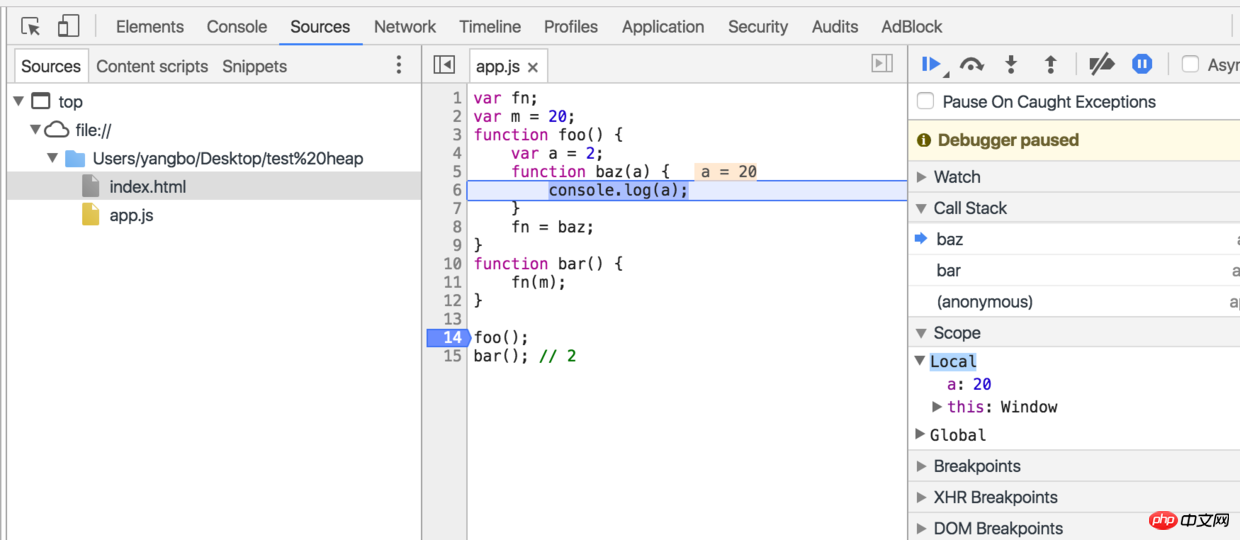
闭包没了,作用域链中没有包含foo了。
是不是结果有点意外,闭包没了,作用域链中没有包含foo了。我靠,跟我们理解的好像又有点不一样。所以通过这个对比,我们可以确定闭包的形成需要两个条件。
在函数内部创建新的函数;
新的函数在执行时,访问了函数的变量对象;
还有更有意思的。
我们继续来看看一个例子。
// demo03

function foo() {
    var a = 2;

    return function bar() {
        var b = 9;

        return function fn() {
            console.log(a);
        }
    }
}

var bar = foo();
var fn = bar();
fn();
在这个例子中,fn只访问了foo中的a变量,因此它的闭包只有foo。
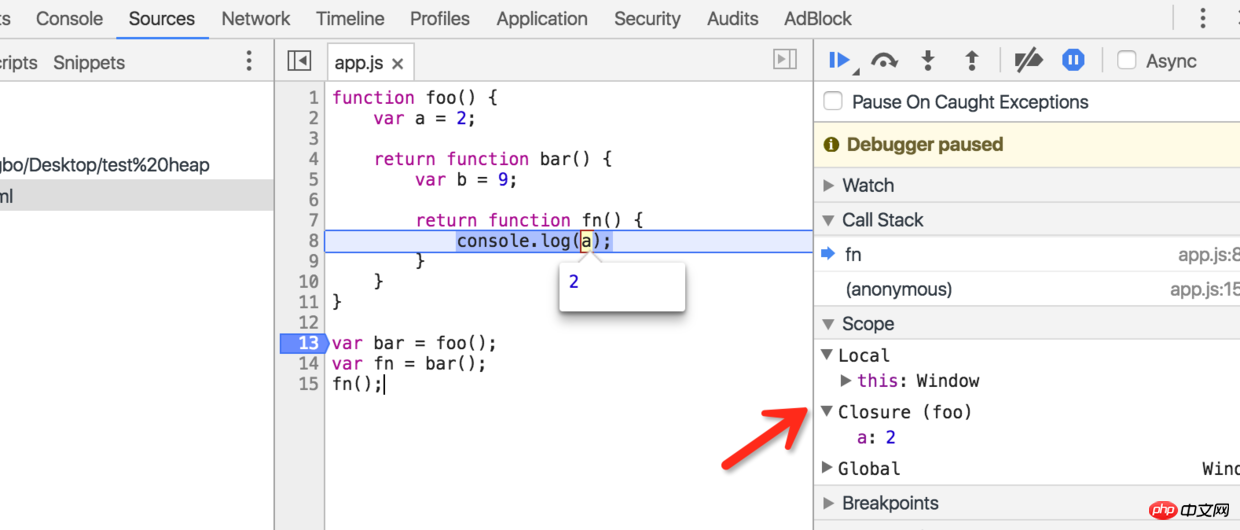
闭包只有foo
修改一下demo03,我们在fn中也访问bar中b变量试试看。
// demo04

function foo() {
    var a = 2;

    return function bar() {
        var b = 9;

        return function fn() {
            console.log(a, b);
        }
    }
}

var bar = foo();
var fn = bar();
fn();
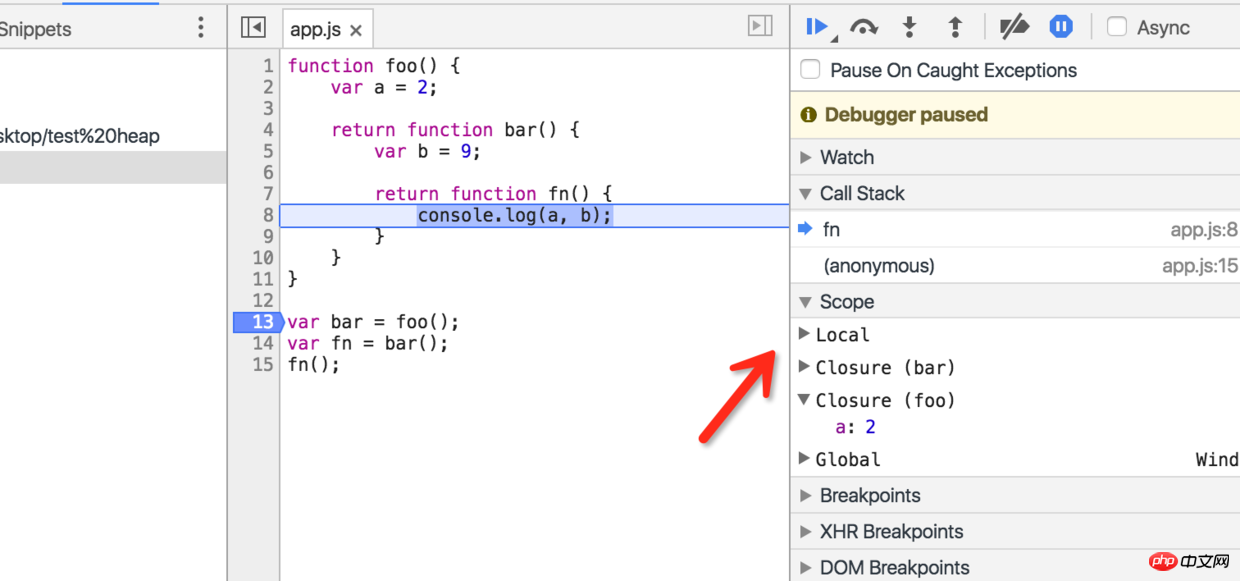
这个时候闭包变成了两个
这个时候,闭包变成了两个。分别是bar,foo。
我们知道,闭包在模块中的应用非常重要。因此,我们来一个模块的例子,也用断点工具来观察一下。
// demo05
(function() {

    var a = 10;
    var b = 20;

    var test = {
        m: 20,
        add: function(x) {
            return a + x;
        },
        sum: function() {
            return a + b + this.m;
        },
        mark: function(k, j) {
            return k + j;
        }
    }

    window.test = test;

})();

test.add(100);
test.sum();
test.mark();

var _mark = test.mark;
_mark();
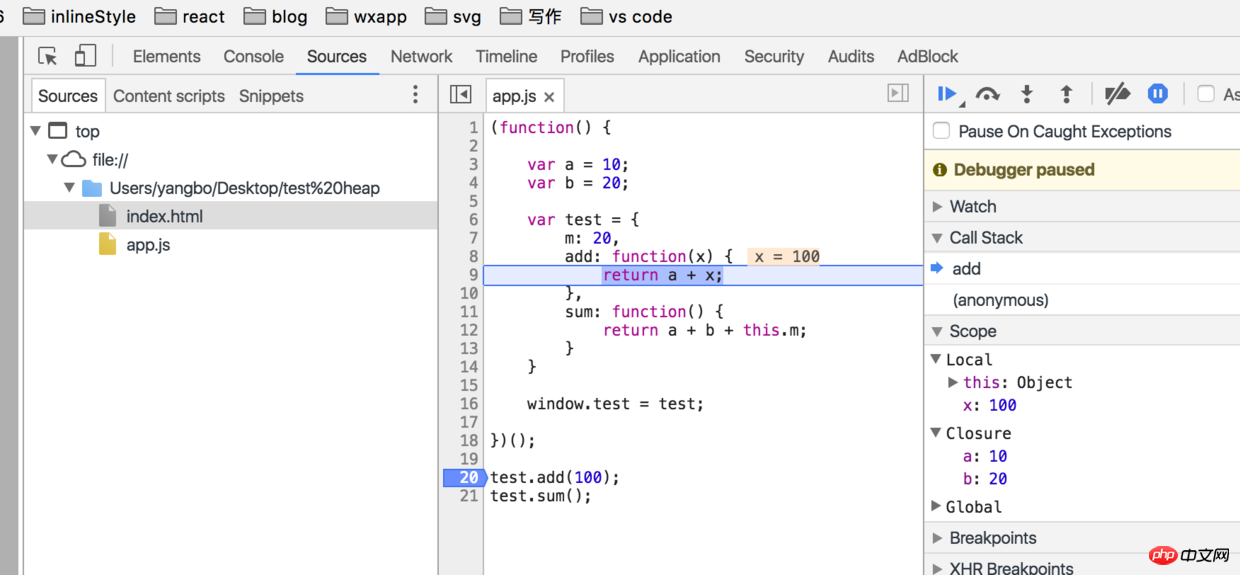
add执行时,闭包为外层的自执行函数,this指向test
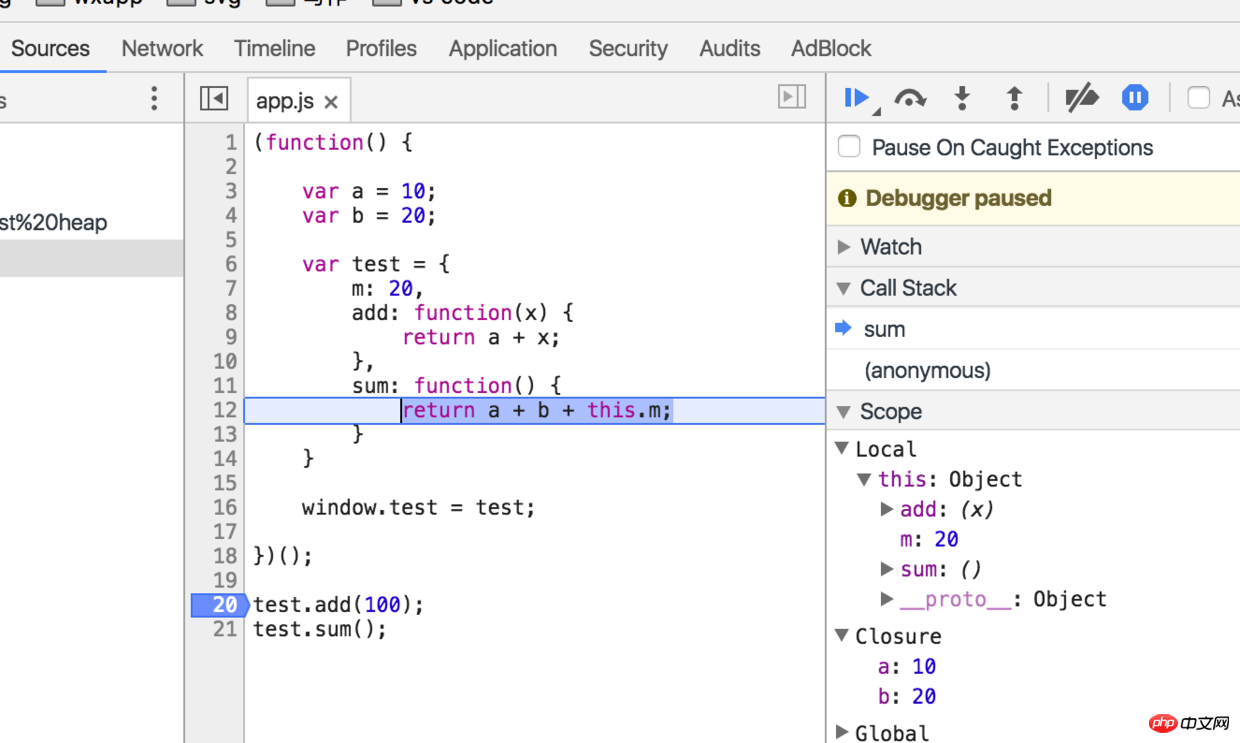
sum执行时,同上
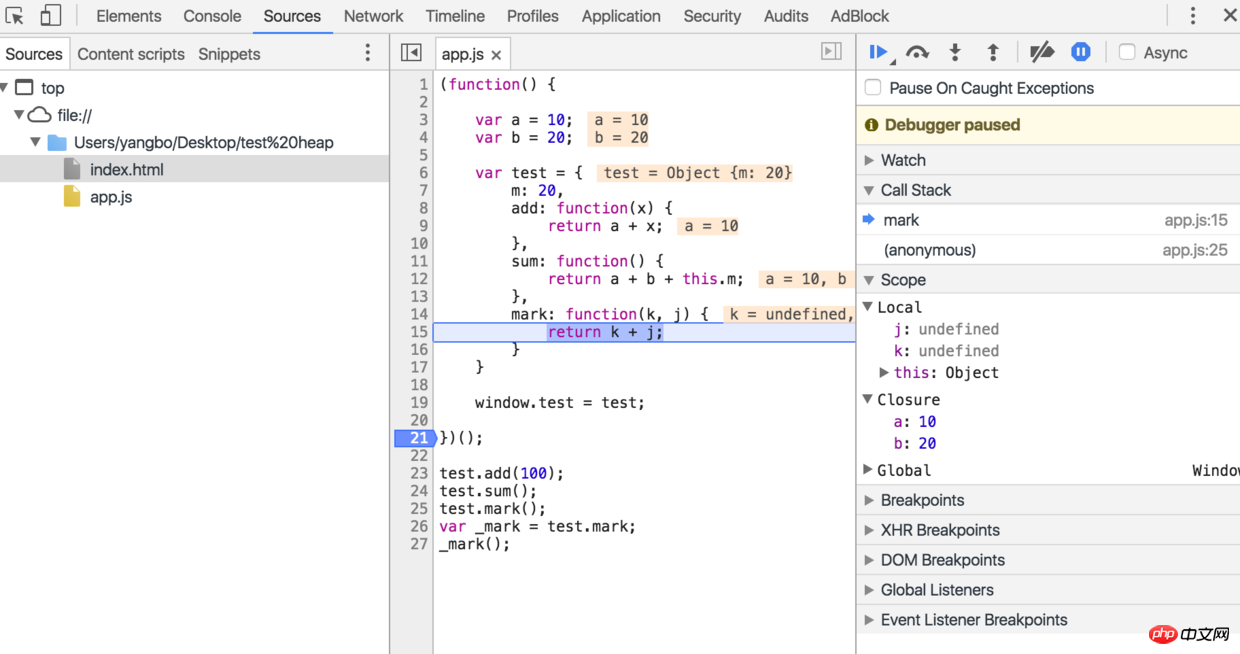
mark执行时,闭包为外层的自执行函数,this指向test
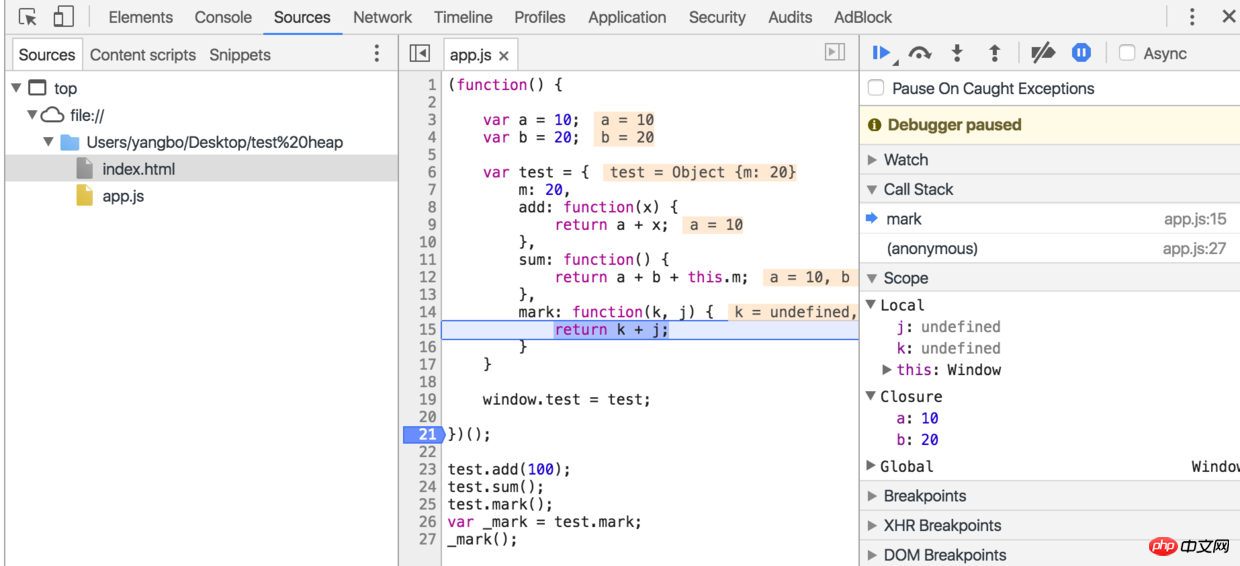
_mark执行时,闭包为外层的自执行函数,this指向window
注意:这里的this指向显示为Object或者Window,大写开头,他们表示的是实例的构造函数,实际上this是指向的具体实例
test.mark能形成闭包,跟下面的补充例子(demo07)情况是一样的。
我们还可以结合点断调试的方式,来理解那些困扰我们很久的this指向。随时观察this的指向,在实际开发调试中非常有用。
// demo06

var a = 10;
var obj = {
    a: 20
}

function fn () {
    console.log(this.a);
}

fn.call(obj); // 20
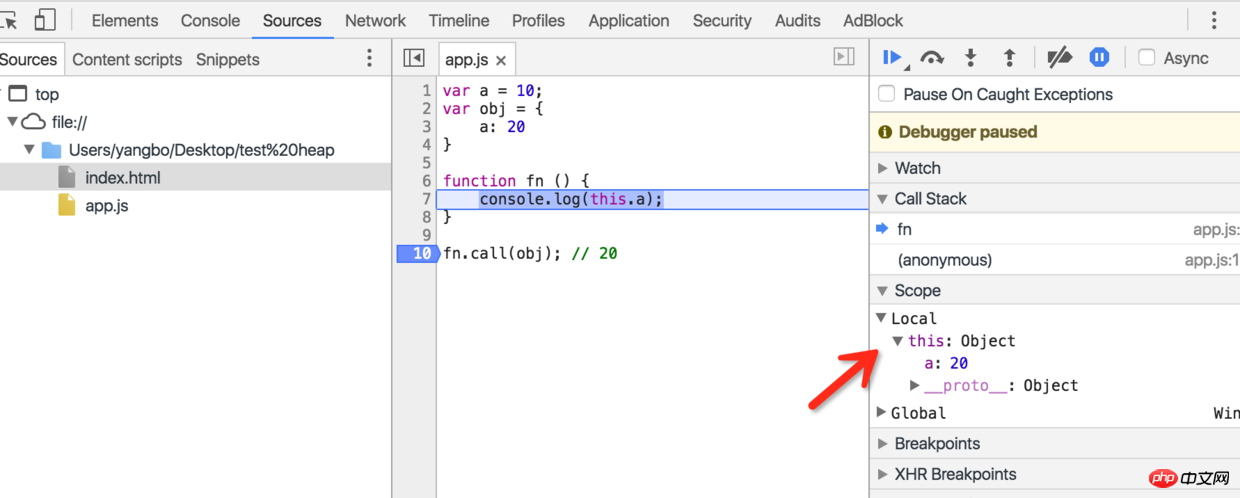
this指向obj
补充一个例子
// demo07
function foo() {
    var a = 10;

    function fn1() {
        return a;
    }

    function fn2() {
        return 10;
    }

    fn2();
}

foo();
这个例子,和其他例子不太一样。虽然fn2并没有访问到foo的变量,但是foo执行时仍然变成了闭包。而当我将fn1的声明去掉时,闭包便不会出现了。我暂时也不知道应该如何解释这种情况。只能大概知道与fn1有关,可能浏览器在实现时就认为只要存在访问上层作用域的可能性,就会被当成一个闭包吧。所以暂时就只能将它作为一个特例记住。
更多的例子,大家可以自行尝试,总之,学会了使用断点调试之后,我们就能够很轻松的了解一段代码的执行过程了。这对快速定位错误,快速了解他人的代码都有非常巨大的帮助。大家一定要动手实践,把它给学会。
最后,根据以上的摸索情况,再次总结一下闭包:
闭包是在函数被调用执行的时候才被确认创建的。
闭包的形成,与作用域链的访问顺序有直接关系。
只有内部函数访问了上层作用域链中的变量对象时,才会形成闭包,因此,我们可以利用闭包来访问函数内部的变量。
chrome中理解的闭包,与《你不知道的js》与《JavaScript高级编程》中的闭包理解有很大不同,我个人更加倾向于相信chrome。这里就不妄下结论了,大家可以根据我的思路,探索后自行确认。在之前一篇文中我根据从书中学到的下了定义,应该是错了,目前已经修改,对不起大家了。
大家也可以根据我提供的这个方法,对其他的例子进行更多的测试,如果发现我的结论有不对的地方,欢迎指出,大家相互学习进步,谢谢大家。
The above is the detailed content of Front-end advancement (6): Observe function call stack, scope chain and closure. For more information, please follow other related articles on the PHP Chinese website!