
Home > Article > Web Front-end > Example code for generating histogram (bar chart) effect in html5

The editor below will share with you an example code for generating a histogram (bar chart) effect in HTML5. The editor thinks it’s pretty good, so I’d like to share it with you now and give you a reference. Let’s follow the editor to take a look
XML/HTML CodeCopy content to the clipboard
html5 generation Histogram (bar chart) detailed code
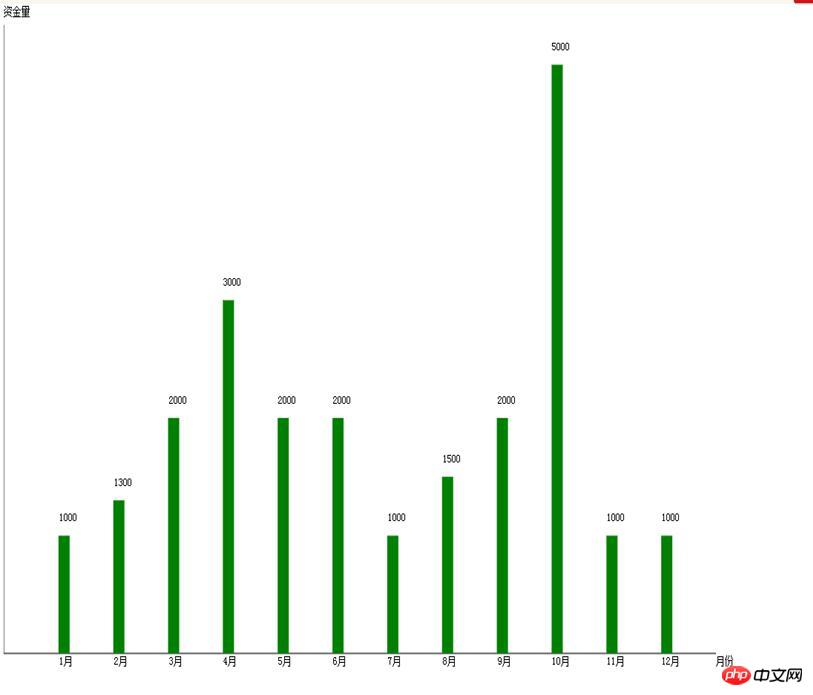
Running results:
Related recommendations:
html5 touch event to achieve touch Swipe the screen up and down (1)
The above is the detailed content of Example code for generating histogram (bar chart) effect in html5. For more information, please follow other related articles on the PHP Chinese website!