
Home > Article > Web Front-end > iChart-component custom graphics library chart/report development tutorial

ichartjs is a graphics library based on HTML5. Use pure JavaScript language and use HTML5 canvas tag to draw various graphics. ichartjs is committed to providing simple, intuitive, and interactive experience-level chart components for your applications. It is a solution for WEB/APP chart display. If you are developing HTML5 applications, ichartjs is just for you. ichartjs currently supports pie charts, donut charts, line charts, area charts, column charts, and bar charts. ichartjs is an open source project based on the Apache License 2.0 agreement.
A journey of a thousand miles begins with a single step. Let's start with Hello World.
First introduce the js file
<script type="text/javascript" src="ichart.1.2.min.js"></script>
Code snippet
//定义数据
$(function(){
            var chart = new iChart.Column2D({
            render : 'canvasp',//渲染的Dom目标,canvasp为Dom的ID
            data: data,//绑定数据
            title : 'Hello World\'s Height In Alphabet',//设置标题
            width : 800,//设置宽度,默认单位为px
            height : 400,//设置高度,默认单位为px
            shadow:true,//激活阴影
            shadow_color:'#c7c7c7',//设置阴影颜色
            coordinate:{//配置自定义坐标轴
            scale:[{//配置自定义值轴
                position:'left',//配置左值轴
                start_scale:0,//设置开始刻度为0
                end_scale:26,//设置结束刻度为26
                scale_space:2,//设置刻度间距
                listeners:{//配置事件
                    parseText:function(t,x,y){//设置解析值轴文本
                        return {text:t+" cm"}
                    }
                }
            }]
        }
Running result
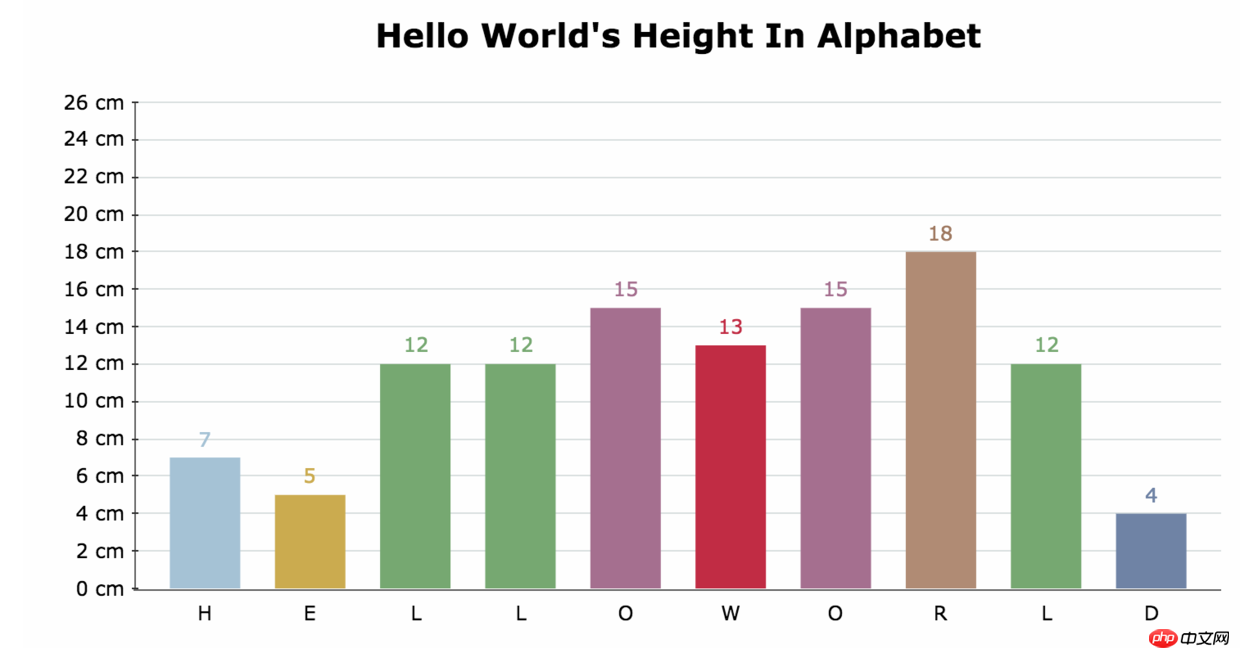
So far , the simple introduction has been completed, but it cannot be limited to this. Expand your thinking. If the histogram is not just a single color fill, but a variety of graphics, or a fill with a gradient effect, how to achieve it?
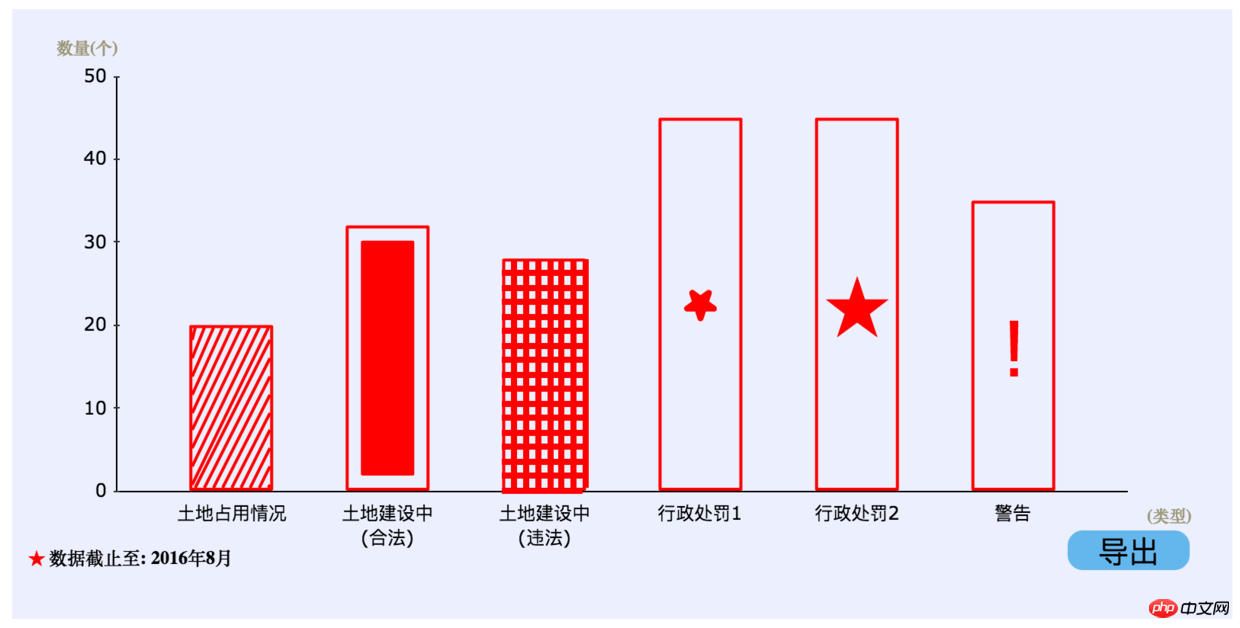
First look at the effect I want to achieve
And then:
I checked the official demo and documentation of ichart, but I didn’t see the effect in this regard, so I had to do it myself, and I had enough food and clothing.
First implement a relatively simple drawing of various strings. Since the bottom layer of ichart is based on canvas, as long as you get the brush, you can draw whatever you want and where you want to draw.
First run the above HelloWorld, single-step Debugging, and find the final drawing entrance.
doDraw:function(_){
    if(_.get('actived')){
        _.drawRectangle();
    }
},
This is the entrance to the final drawing. It can be seen that only rectangles can be drawn in the source code, which feels so simple.
The modified entry:
doDraw:function(_){
    if(_.get('actived')){
      var _ = this._();
      var type = _.options.type;
      if(type === 'slash'){
        _.drawSlash();
      }else if(type === 'innerRect'){
        _.drawInnerRect();
      }else if(type === 'wire'){
        _.drawWire();
      }else if(type === 'star'){
        _.drawStar();
      }else if(type === 'exclamation'){
        _.drawExclamation();
      }else if(type ==='innerRectAndLine'){
        _.drawInnerRectAndLine();
      }else if(type === 'judge'){
        _.drawJudge();
      }else{
        _.drawRectangle();
      }
    }
  },
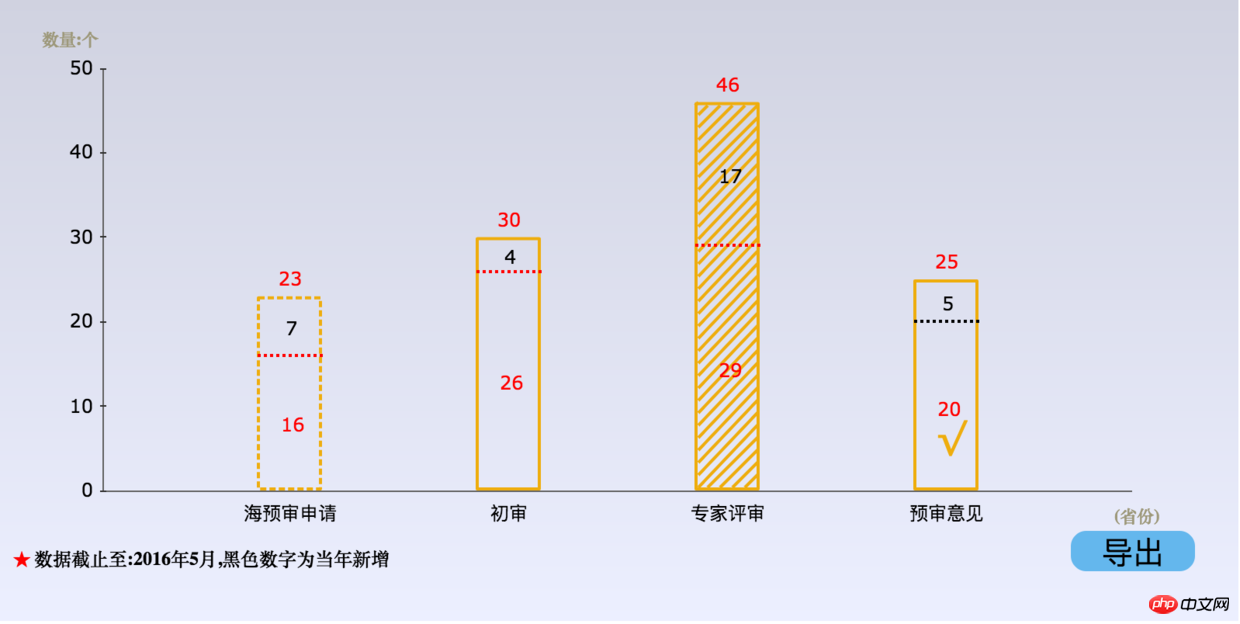
The rectangle is still drawn by default, but according to the passed in category, graphics can be drawn, such as type===' exclamation', the program will call the _.drawExclamation(); method. Let’s take a look at the definition of the drawExclamation() method:
drawExclamation: function() {
   var _ = this._();
   var x = _.get(_.X), y = _.get(_.Y), w=_.get(_.W), h=_.get(_.H), border=_.get('border'), f_color=_.get('f_color'), shadow=_.get('shadow');
   _.T.box(
    _.get(_.X),
    _.get(_.Y),
    _.get(_.W),
    _.get(_.H),
    _.get('border'),
    _.get('f_color'),
    _.get('shadow'));
   var character = _.options.character && _.options.character.value;
   _.T.textStyle(_.L, 'middle', $.getFont(_.get('fontweight'), _.get('fontsize'), _.get('font')));
   _.T.fillText(character, x + w/2 - _.T.measureText(character)/2, y+h/2, _.get('textwidth'), border.color);
 },
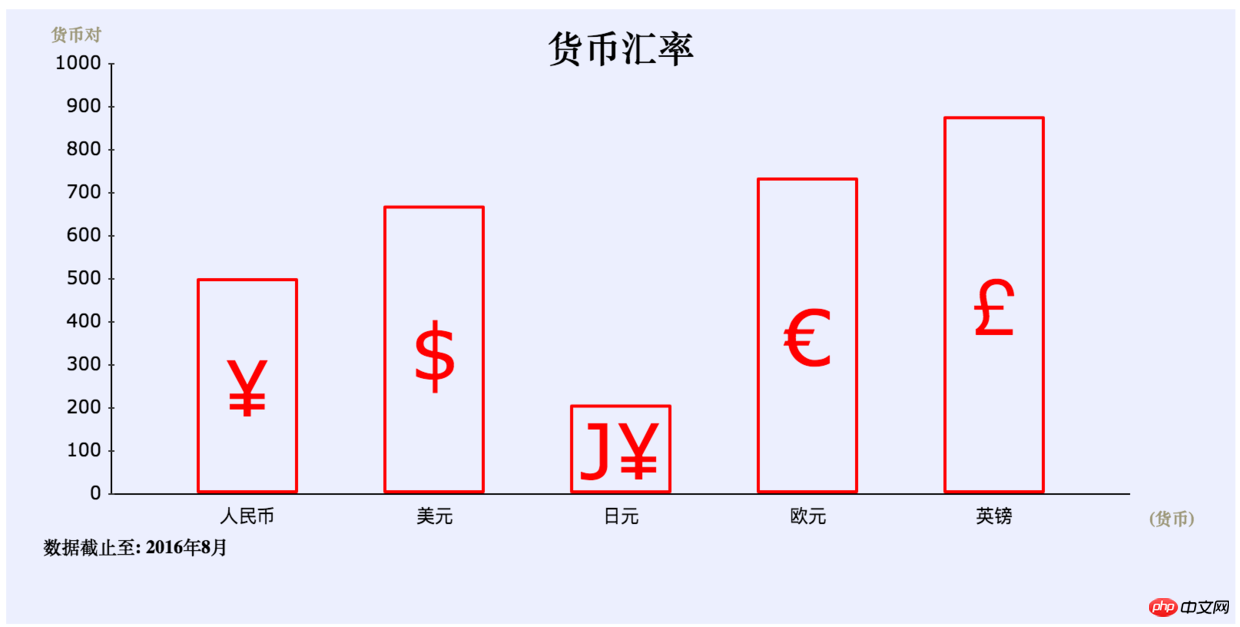
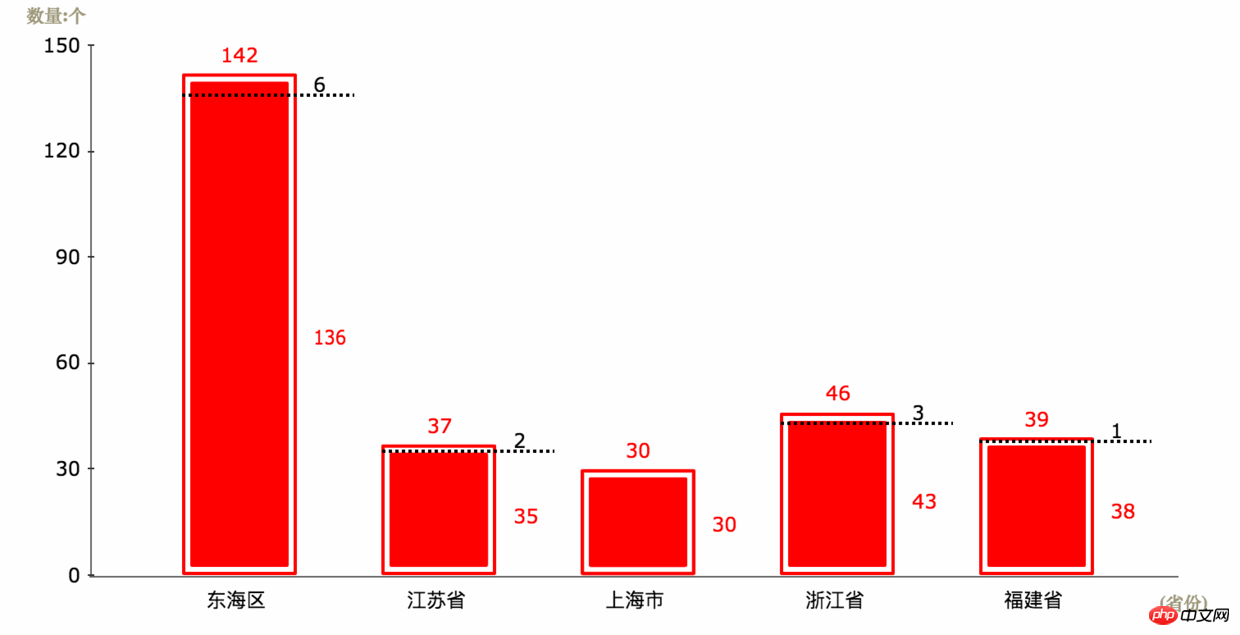
As shown in the code, first draw the rectangular Box, and then draw the incoming text, so that our currency exchange rate table can be easily implemented.
drawSlash: function(){
    var _ = this._();
    var x = _.get(_.X), y = _.get(_.Y), w=_.get(_.W), h=_.get(_.H), border=_.get('border'), f_color=_.get('f_color'), shadow=_.get('shadow');
    _.T.box(
      _.get(_.X),
      _.get(_.Y),
      _.get(_.W),
      _.get(_.H),
      _.get('border'),
      _.get('f_color'),
      _.get('shadow'));
    var difcount = 9;
    var a = h/w, dx = parseInt(w/difcount), dy = dx * a;
    for(var i = x + dx;i<= x+w; i+=dx){
      var x0 = i - border.width,y0 = y + border.width;
      var x1 = x + border.width, y1 = y + dy * (i-x)/dx - border.width;
      _.T.line(x0,y0,x1,y1, border.width, border.color, false);
      if(i !== x){
        var x0 = i - border.width,y0 = y + h - border.width;
        var x1 = x + w - border.width, y1 = y + dy * (i-x)/dx - border.width;
        _.T.line(x0,y0,x1,y1, border.width, border.color, false);
      }
    }
  },
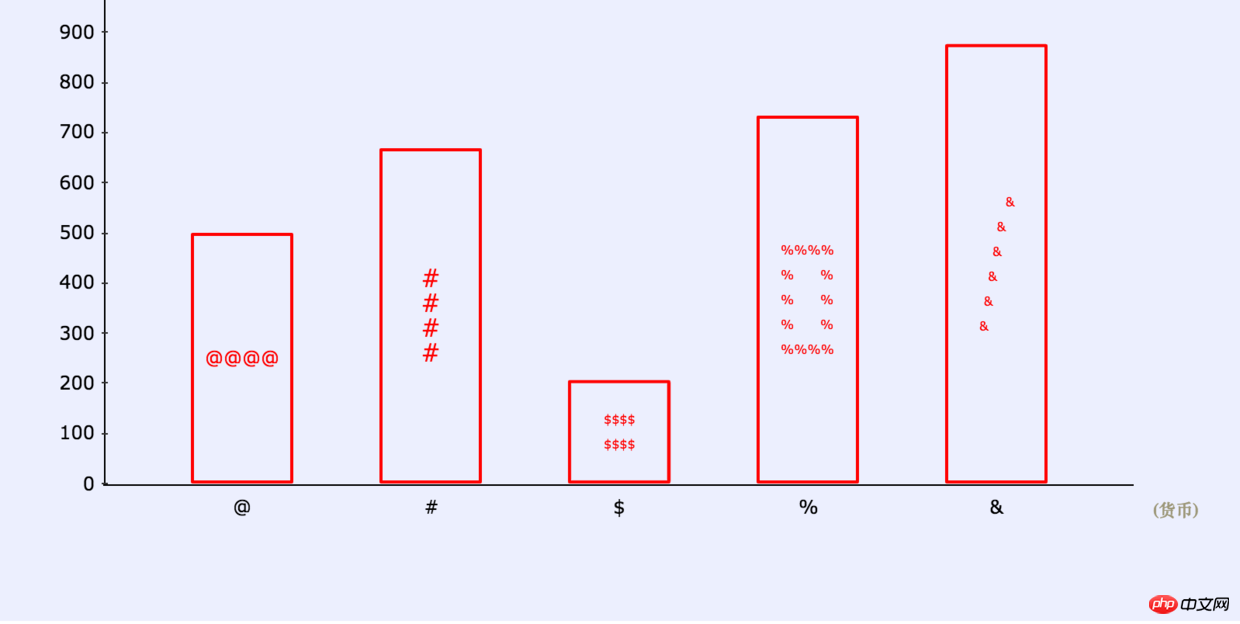
Rendering:
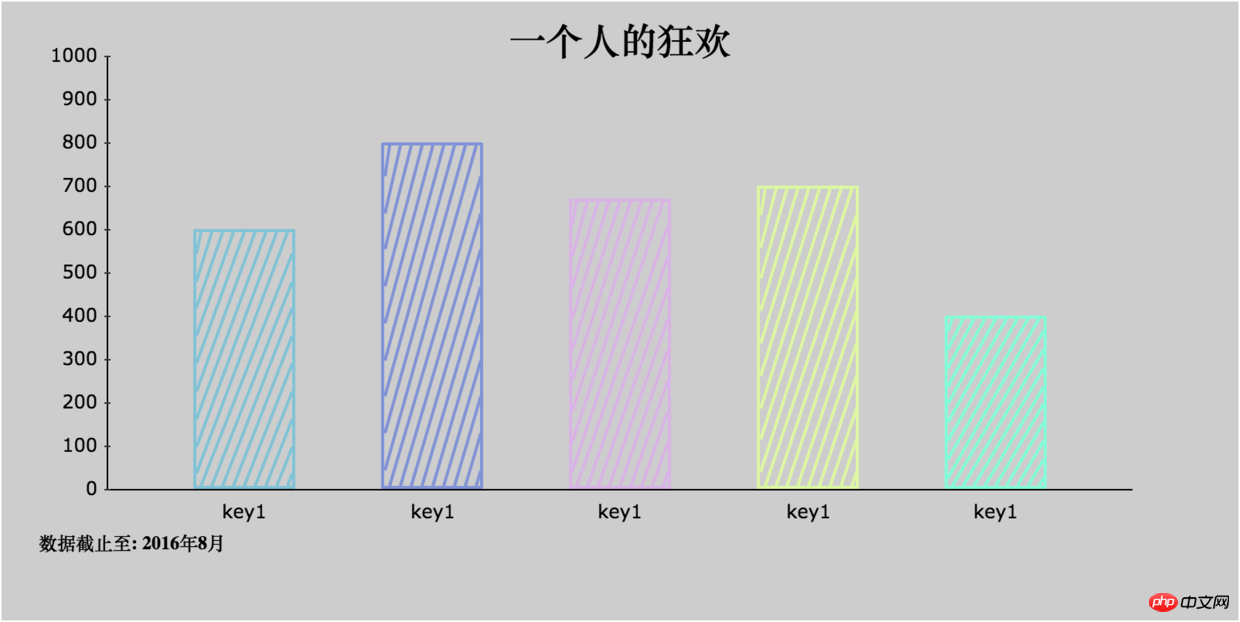
Other shapes The icons are similar and will not be stated again. Let’s take a look at some more renderings:
The above is the detailed content of iChart-component custom graphics library chart/report development tutorial. For more information, please follow other related articles on the PHP Chinese website!