Home  >  Article  >  Technology peripherals  >  Machine learning powers high-quality software engineering

Machine learning powers high-quality software engineering

PHPz
PHPzforward
2023-04-14 16:31:12682browse

Translator | Zhu Xianzhong

##Revised | Sun Shujuan

Introduction

Generally speaking, Software testing tends to be relatively simple: every input => known output. However, throughout the history of software testing, you will find that many tests often remain at the level of guesswork. In other words, during testing, the developer imagines the user's operation process, estimates the possible load and analyzes the time it will take, then runs the test and compares the current results with the baseline answer. If we find that there is no regression, then the current build plan is considered correct; then, continue with subsequent testing. If there is a regression, return it. Most of the time, we already know the output, although it needs to be better defined - the boundaries of the regression are clear and not that fuzzy. In fact, this is where machine learning (ML) systems and predictive analytics come in – ending ambiguity.

After the test is completed, the performance engineer will not only look at the arithmetic mean and geometric mean of the results, they will also look at the relevant percentage data. For example, when the system is running, often 10% of the slowest requests are caused by system errors - this error will create a condition that always affects the speed of the program.

While we can manually correlate the attributes available in the data, ML may link the data attributes faster than you can. After identifying the conditions that cause 10% of bad requests, performance engineers can build test scenarios to reproduce the behavior. Running tests before and after a fix can help confirm that the fix has been corrected.

Machine learning powers high-quality software engineering

Figure 1: Overall Confidence in Performance Metrics

Performance of Machine Learning and Data Science

Machine learning helps promote software development and makes the development technology more robust and better able to meet the needs of users in different fields and industries. We can expose causal patterns by feeding data from pipelines and environments into deep learning algorithms. Predictive analytics algorithms combined with performance engineering methods enable more efficient and faster throughput, gain insights into how end users use software in natural scenarios, and help developers reduce the likelihood of defective products being used in production environments . By identifying issues and their causes early on, you can correct them early in the development lifecycle and prevent impact on production. Overall, here are some ways you can leverage predictive analytics to improve application performance.

  • Determine the root cause. You can use machine learning techniques to determine the root cause of availability or performance issues to focus on other areas that need attention. Predictive analytics can then analyze various characteristics of each cluster, providing insights into the changes we need to make to achieve ideal performance and avoid bottlenecks.
  • Monitor application health. Using machine learning technology to perform real-time application monitoring helps enterprises detect system performance degradation in time and respond quickly. Most applications rely on multiple services to obtain the status of the complete application; predictive analytics models are able to correlate and analyze data when the application is running normally to identify whether incoming data is an outlier.
  • Predict user load. We rely on peak user traffic to size our infrastructure to accommodate the number of users accessing our application in the future. This approach has limitations because it does not account for changes or other unknown factors. Predictive analytics helps visualize user load and better prepare for response, helping teams plan their infrastructure needs and capacity utilization.
  • Predict downtime before it’s too late. Predicting application downtime or outages before they occur will help take preventive measures. Predictive analytics models will follow previous outage scenarios and continue to monitor similar situations to predict future outages.
  • Stop viewing thresholds and start analyzing data. The massive amounts of data generated by observability and monitoring require up to several hundred megabytes per week. Even with modern analysis tools, you must know in advance what you are looking for. This results in teams not looking directly at the data, but instead setting thresholds as triggers for action. Even mature teams look for exceptions instead of digging into their data. To mitigate this, we integrate the model with available data sources. The model then filters the data and calculates thresholds over time. Using this technique, the model is fed and aggregated historical data, providing thresholds based on seasonality rather than set by humans. Setting thresholds based on algorithms helps trigger fewer alerts; on the other hand, this also leads to better actionability and higher value.
  • Analyze and correlate across data sets. Your data is mostly time series, so it's easier to see individual variables changing over time. Many trends arise from the interaction of multiple measures. For example, response time will only drop if various transactions are happening simultaneously on the same target. For humans, this is nearly impossible, but properly trained algorithms can help discover these correlations.

The Importance of Data in Predictive Analytics

“Big Data” usually refers to a data set. Yes, it is a large data set, the speed increases quickly, and the content changes greatly. The analysis of such data requires specialized methods so that we can extract patterns and information from it. In recent years, improvements in storage, processors, process parallelism, and algorithm design have enabled systems to process large amounts of data in a reasonable amount of time, allowing for wider use of these methods. To obtain meaningful results, you must ensure data consistency.

For example, each project must use the same ranking system, so if one project uses 1 as a key value and another uses 5 - like people using "DEFCON 5 ” means “DEFCON 1”; then the values ​​must be normalized before processing. Predictive algorithms consist of algorithms and the data they feed into, and software development generates vast amounts of data that, until recently, sat idle, waiting to be deleted. However, predictive analytics algorithms can process these files to ask and answer questions based on this data for patterns we cannot detect, such as: Are we wasting time testing unknowns? Scenario of use?

  • How do performance improvements relate to user happiness?
  • How long will it take to fix a specific defect?
  • #These questions and their answers are what predictive analytics is for—to better understand what is likely to happen.
  • Algorithms

    The other major component of predictive analytics is the algorithm; you need to choose or implement it carefully. Starting simple is crucial because models tend to become increasingly complex, increasingly sensitive to changes in input data, and potentially distort predictions. They can solve two types of problems: classification and regression (see Figure 2).

    • Classification: Classification is used to predict the outcome of a set by inferring a label (such as "down" or "up") from the input data To start, divide the collection into different categories.
    • Regression: Regression is used to predict the outcome of a set when the output variable is a set of real values. It will process input data to make predictions - for example, the amount of memory used, lines of code written by developers, etc. The most commonly used prediction models are neural networks, decision trees, and linear and logistic regression.

    Machine learning powers high-quality software engineering

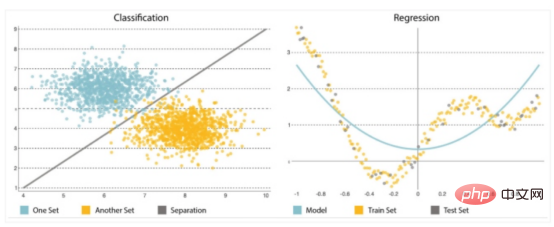
    ##Figure 2: Classification and Regression

    Neural Network

    Neural networks learn by example and use historical and current data to predict future value. Their architecture allows them to identify complex relationships hidden in data, replicating the way our brains detect patterns. They consist of many layers that accept data, compute predictions and provide the output as a single prediction.

    Decision Tree

    A decision tree is an analytical method that presents results in a series of "if/then" options to predict the potential risks of a specific option and earnings. It can solve all classification problems and answer complex questions.

    As shown in Figure 3, a decision tree is similar to a top-down tree generated by an algorithm that recognizes various ways of splitting data into branch-like partitions to Explain future decisions and help identify decision paths.

    If it takes more than three seconds to load, one branch in the tree might be a user who abandoned their cart. Below this, another branch may indicate whether they are female. A "yes" answer raises the stakes, as analysis shows women are more likely to make impulsive purchases, and this delay can lead to rumination.

    Machine learning powers high-quality software engineering

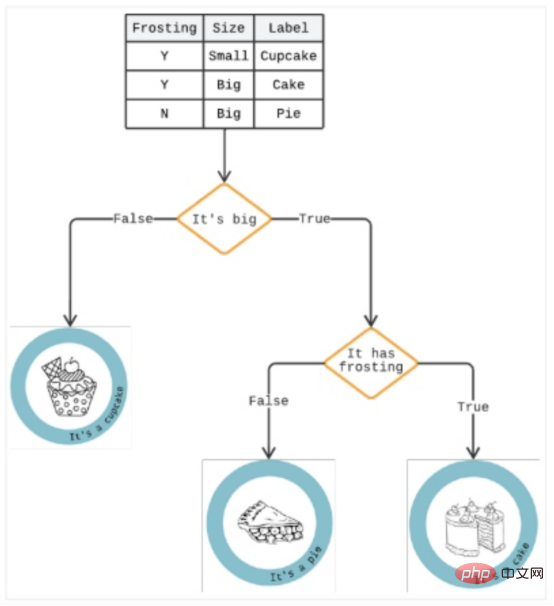
    Figure 3: Decision tree example
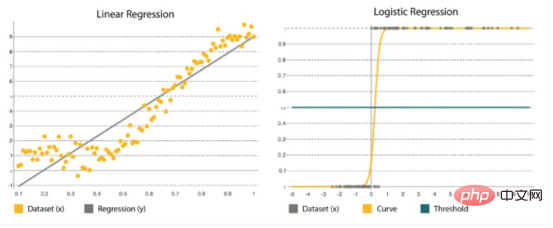
    Linear and logistic regression

    Regression It is one of the most popular statistical methods. This is critical when estimating numbers, such as how many additional resources we need to add to each service during the Black Friday sale. Many regression algorithms are designed to estimate relationships between variables and find key patterns in large and mixed data sets, as well as the relationships between them. It ranges from simple linear regression models (computing a straight line function that fits the data) to logistic regression (computing a curve) (Figure 4).

    Machine learning powers high-quality software engineering

    Figure 4: Linear Regression vs. Logistic Regression

    These are supervised learning methods because the algorithm solves for specific attributes. Unsupervised learning is used when you don't have a specific outcome in mind, but want to identify possible patterns or trends. In this case, the model will analyze as many combinations of features as possible to find correlations that humans can act on.

    Machine learning powers high-quality software engineering

    Figure 5: Supervised and unsupervised learning

    "Shift left" in performance engineering

    Uses previous algorithms to measure consumer perceptions of products and applications, making performance engineering more consumer-centric. Once all the information is collected, it must be stored and analyzed through appropriate tools and algorithms. This data can include error logs, test cases, test results, production events, application log files, project documents, event logs, traces, and more. We can then apply this to the data to gain various insights:

    • Defects in the Analytical Environment
    • Assessment Impact on customer experience
    • Identify problem patterns
    • Create more accurate test scenarios, and more

    This technology supports a shift-left approach to quality, allowing you to predict the time it will take to perform performance testing, the number of defects that may be identified, and the number of defects that may lead to production, thereby enabling performance testing. Better coverage and create authentic user experiences. Usability, compatibility, performance, and security issues can be prevented and corrected without impacting users.

    Here are some examples of the types of information that can help improve quality:

    • Defect Types
    • At which stage the defect was discovered
    • What is the root cause of the defect
    • Is the defect reproducible

    Once you understand this, you can make changes and create tests to prevent similar problems faster.

    Conclusion

    Software engineers have made hundreds of assumptions since the dawn of programming. But today’s digital users are more aware of this and less tolerant of mistakes and failures. On the other hand, businesses are also racing to provide more engaging and polished user experiences through tailored services and complex software that is increasingly difficult to test.

    Today, everything needs to work seamlessly and support all popular browsers, mobile devices, and apps. A crash of even a few minutes can cause thousands or millions of dollars in damage. To prevent issues from arising, teams must integrate observability solutions and user experience throughout the software lifecycle. Managing the quality and performance of complex systems requires more than just executing test cases and running load tests. Trends can help you determine whether a situation is under control, improving, or worsening, and how quickly. Machine learning technology can help predict performance issues so teams can make corrective adjustments. Finally, let us conclude with a quote from Benjamin Franklin: “An ounce of prevention is worth a pound of cure.”

    Translator’s Introduction

    Zhu Xianzhong, 51CTO community editor, 51CTO expert blogger, lecturer, computer teacher at a university in Weifang, and a veteran in the freelance programming industry.

    Original title: Performance Engineering Powered by Machine Learning, Author:

    #Linear and Logistic RegressionOverall comparison

    ##Linear return

    Logistic regression

    ## is used to define values ​​in a continuous range, such as the risk of user traffic spikes in the next few months.

    #This is a statistical method in which parameters are predicted based on old sets. It works best for binary classification: datasets where y=0 or 1, where 1 represents the default class . Its name comes from its conversion function ( is a logical function ) .

    It is expressed as y=a bx, where x is the input set used to determine the output y. The coefficients a and b are used to quantify the relationship between x and y, where a is the intercept and b is the slope of the line.

    It is represented by a logical function:


    where, β0 is the intercept, β1 is the rate. It uses training data to calculate coefficients that minimize the error between predicted and actual results.

    The goal is to fit the straight line closest to most points, reducing the distance or error between y and the straight line.

    # It forms an S-shaped curve where a threshold is applied to convert the probabilities into binary classifications.

The above is the detailed content of Machine learning powers high-quality software engineering. For more information, please follow other related articles on the PHP Chinese website!

Statement:
This article is reproduced at:51cto.com. If there is any infringement, please contact admin@php.cn delete