Home>Article>Development Tools> Vagrant+PHPStorm implements XDebug breakpoint debugging

Vagrant+PHPStorm implements XDebug breakpoint debugging

藏色散人
藏色散人 forward
2022-01-20 17:31:50 2702browse

The following tutorial column will introduce you to Vagrant PHPStorm Google XDebug breakpoint debugging. I hope it will be helpful to friends in need!Vagrant PHPStorm Google XDebug breakpoint debugging

2. In PHPStorm-> ;Preferences->Languages & Frameworks->PHP The arrow points to the configuration

selection, select from vagrant
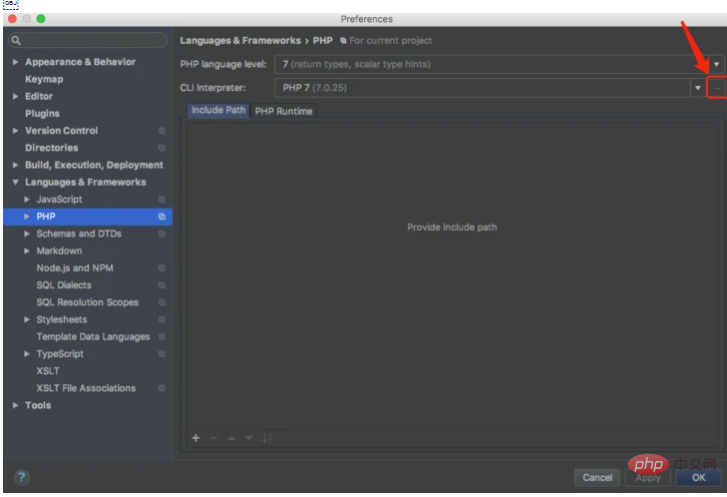
Vagrant+PHPStorm implements XDebug breakpoint debugging


# #Configuration is as follows:Vagrant+PHPStorm implements XDebug breakpoint debugging

## Set in PHP->Debug->DBGp Proxy as follows

Vagrant+PHPStorm implements XDebug breakpoint debugging

Set the port in PHP->Debug

Vagrant+PHPStorm implements XDebug breakpoint debugging

##Set the mapping path in PHP->Servers

Vagrant+PHPStorm implements XDebug breakpoint debugging

3. Download Xdebug helper from google and configure

Vagrant+PHPStorm implements XDebug breakpoint debugging

Note: If breakpoints are not available, it means that Xdebug and php versions do not correspond. You can set 20-xdebug.ini of other php versions.

The above is the detailed content of Vagrant+PHPStorm implements XDebug breakpoint debugging. For more information, please follow other related articles on the PHP Chinese website!

Statement:
This article is reproduced at:segmentfault.com. If there is any infringement, please contact admin@php.cn delete