Implementation method: First open the excel table that needs to be operated and select the abscissa; then right-click the mouse and click "Select Data" in the pop-up right-click menu; then select "Switch Rows" in the pop-up new window /Column", click "OK" to switch the horizontal and vertical coordinates.

The operating environment of this tutorial: Windows 7 system, Microsoft Office Excel 2010 version, Dell G3 computer.
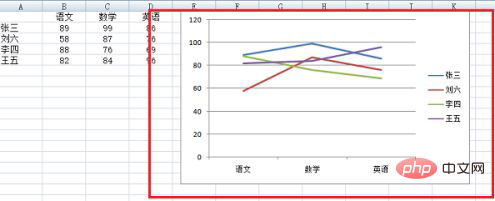
First open the table, the table data has generated a line chart
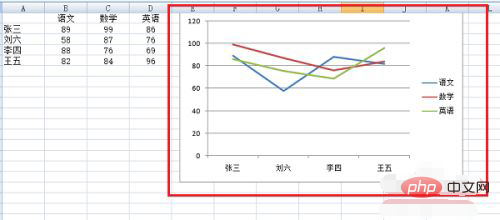
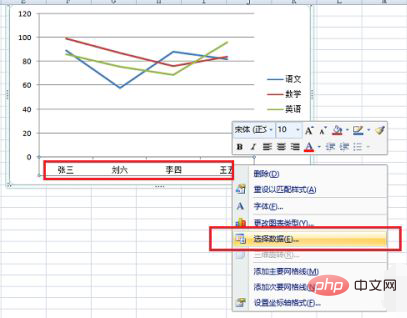
Click on the abscissa, right-click the mouse, and select the data, as shown in the following figure:
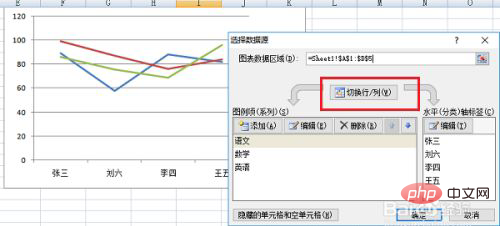
After entering the data source selection interface, click Switch Rows and Rows to switch the horizontal and vertical coordinates, as shown in the following figure:
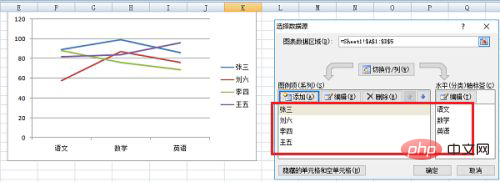
Click OK, you can see that the horizontal and vertical coordinates of the line chart have been switched, or you can edit the settings individually, as shown below:
Related learning recommendations: excel tutorial
The above is the detailed content of How to realize the interchange of horizontal and vertical coordinates in excel line chart. For more information, please follow other related articles on the PHP Chinese website!