汽车销量:
- 大众
- 丰田
- 别克
- 福特
- 长安
Home > Article > Web Front-end > javascript实现动态统计图开发实例_javascript技巧
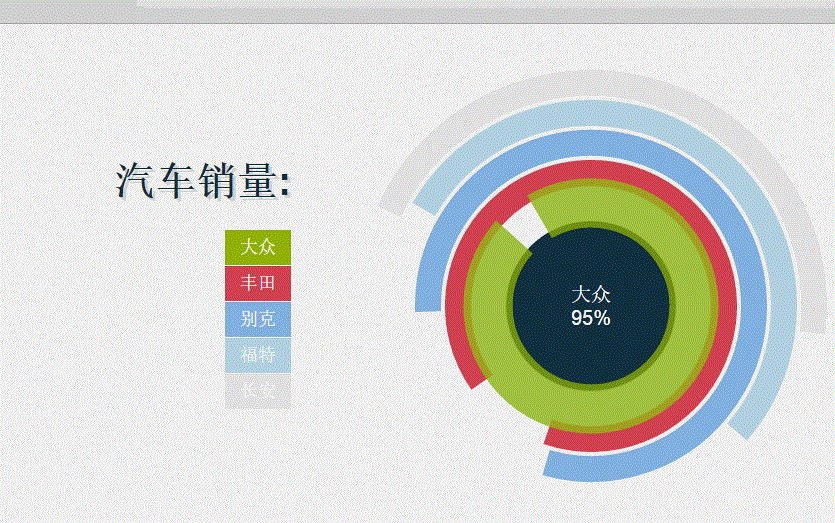
本文实例讲述了javascript实现动态统计图的代码。分享给大家供大家参考。具体如下:
运行效果截图如下:

具体代码如下
html代码:
汽车销量:
- 大众
- 丰田
- 别克
- 福特
- 长安
大众丰田别克福特长安
css代码:
#content {
position:absolute;
top:50%;
left:50%;
margin:-340px 0 0 -450px;
width:900px;
height:600px;
}
.legend {
float:left;
width:250px;
margin-top:140px;
}
#content h1 {
font-family:'Cabin Sketch', arial, serif;
text-shadow:3px 3px 0 #ddd;
color:#193340;
font-size:40px;
margin-bottom:40px;
text-align:right;
}
.skills {
float:left;
clear:both;
width:100%;
}
.skills ul,
.skills li {
display:block;
list-style:none;
margin:0;
padding:0;
}
.skills li {
float:right;
clear:both;
padding:0 15px;
height:35px;
line-height:35px;
color:#fff;
margin-bottom:1px;
font-size:18px;
}
js代码:
var o = {
      init: function () {
        this.diagram();
      },
      random: function (l, u) {
        return Math.floor((Math.random() * (u - l + 1)) + l);
      },
      diagram: function () {
        var r = Raphael('diagram', 600, 600),
          rad = 73;
        r.circle(300, 300, 85).attr({ stroke: 'none', fill: '#193340' });
        var title = r.text(300, 300, 'loading...').attr({
          font: '20px Arial',
          fill: '#fff'
        }).toFront();
        r.customAttributes.arc = function (value, color, rad) {
          var v = 3.6 * value,
            alpha = v == 360 ? 359.99 : v,
            random = o.random(91, 240),
            a = (random - alpha) * Math.PI / 180,
            b = random * Math.PI / 180,
            sx = 300 + rad * Math.cos(b),
            sy = 300 - rad * Math.sin(b),
            x = 300 + rad * Math.cos(a),
            y = 300 - rad * Math.sin(a),
            path = [['M', sx, sy], ['A', rad, rad, 0, +(alpha > 180), 1, x, y]];
          return { path: path, stroke: color }
        }
        $('.get').find('.arc').each(function (i) {
          var t = $(this),
            color = t.find('.color').val(),
            value = t.find('.percent').val(),
            text = t.find('.text').text();
          rad += 30;
          var z = r.path().attr({ arc: [value, color, rad], 'stroke-width': 26 });
          z.mouseover(function () {
            this.animate({ 'stroke-width': 50, opacity: .75 }, 1000, 'elastic');
            if (Raphael.type != 'VML') //solves IE problem
    this.toFront();
            title.animate({ opacity: 0 }, 500, '>', function () {
              this.attr({ text: text + '\n' + value + '%' }).animate({ opacity: 1 }, 500, '<');
            });
          }).mouseout(function () {
            this.animate({ 'stroke-width': 26, opacity: 1 }, 1000, 'elastic');
          });
        });
      }
    }
    $(function () { o.init(); });
希望本文所述对大家学习javascript程序设计有所帮助。