
Home > Article > Backend Development > How to use Python to analyze and visualize NetEase Cloud playlist data

NetEase Cloud Music is a music product developed by NetEase. It is the result of NetEase Hangzhou Research Institute and relies on professional music People, DJs, friend recommendations and social functions, the online music service focuses on playlists, social networking, big name recommendations and music fingerprints, with playlists, DJ programs, social networking and geographical location as the core elements, focusing on discovery and sharing. Crawl the playlist part of the official website of NetEase Cloud Music, obtain data from the NetEase Cloud Music playlist, obtain all playlists of a certain song style, and obtain the name, tag, introduction, collection volume, playback volume, and song list of the playlist. The number of songs included in the single, as well as the number of comments.
For the crawled The data is preprocessed, and the preprocessed data is analyzed to analyze the number of playlists played, the number of songlist collections, the number of songlist comments, the collection of songlists, songlist tags, songlist contributors, etc. And perform visualization to reflect the analysis results more intuitively.
Listening to music Music is a way for many young people to express their emotions today. NetEase Cloud Music is a popular way to express emotions. Music platform, you can analyze the playlist of NetEase Cloud Music to understand the problems faced by young people in today's society, as well as various emotional pressures; you can also understand user preferences and analyze what kind of songs Playlists are the most popular among the public, they can also reflect the public's preferences, and they also play a very important role in the creation of music creators. From the perspective of ordinary users, for playlist creators, on the one hand, creating playlists facilitates the classification and management of their own collection of music libraries. On the other hand, producing high-quality playlists can highlight their own music taste. Receiving likes and comments gives you a great sense of accomplishment and satisfaction. "Playlist" listening to music is very important to consumers and can significantly enhance the user's listening experience. For musicians, radio hosts and other types of playlist creators, "playlists" can better spread their music and works, and can also better interact with fans and expand their popularity.
This project crawls data from the Chinese playlist part of NetEase Cloud’s official website. The crawling address is: Chinese Playlist - Playlist - NetEase Cloud Music
Enter each page, get each song list on the page, and enter a single song list , the song list name, collection volume, number of comments, tags, introduction, total number of songs, play volume, included song titles and other data are all stored in the same div of the web page, and each content is selected through the selector.
from bs4 import BeautifulSoup
import requests
import time
headers = {
'User-Agent': 'Mozilla/5.0 (Windows NT 6.1; WOW64) AppleWebKit/537.36 (KHTML, like Gecko) Chrome/63.0.3239.132 Safari/537.36'
}
for i in range(0, 1330, 35):
print(i)
time.sleep(2)
url = 'https://music.163.com/discover/playlist/?cat=华语&order=hot&limit=35&offset=' + str(i)#修改这里即可
response = requests.get(url=url, headers=headers)
html = response.text
soup = BeautifulSoup(html, 'html.parser')
# 获取包含歌单详情页网址的标签
ids = soup.select('.dec a')
# 获取包含歌单索引页信息的标签
lis = soup.select('#m-pl-container li')
print(len(lis))
for j in range(len(lis)):
# 获取歌单详情页地址
url = ids[j]['href']
# 获取歌单标题
title = ids[j]['title']
# 获取歌单播放量
play = lis[j].select('.nb')[0].get_text()
# 获取歌单贡献者名字
user = lis[j].select('p')[1].select('a')[0].get_text()
# 输出歌单索引页信息
print(url, title, play, user)
# 将信息写入CSV文件中
with open('playlist.csv', 'a+', encoding='utf-8-sig') as f:
f.write(url + ',' + title + ',' + play + ',' + user + '\n')
from bs4 import BeautifulSoup
import pandas as pd
import requests
import time
df = pd.read_csv('playlist.csv', header=None, error_bad_lines=False, names=['url', 'title', 'play', 'user'])
headers = {
'User-Agent': 'Mozilla/5.0 (Windows NT 6.1; WOW64) AppleWebKit/537.36 (KHTML, like Gecko) Chrome/63.0.3239.132 Safari/537.36'
}
for i in df['url']:
time.sleep(2)
url = 'https://music.163.com' + i
response = requests.get(url=url, headers=headers)
html = response.text
soup = BeautifulSoup(html, 'html.parser')
# 获取歌单标题
title = soup.select('h3')[0].get_text().replace(',', ',')
# 获取标签
tags = []
tags_message = soup.select('.u-tag i')
for p in tags_message:
tags.append(p.get_text())
# 对标签进行格式化
if len(tags) > 1:
tag = '-'.join(tags)
else:
tag = tags[0]
# 获取歌单介绍
if soup.select('#album-desc-more'):
text = soup.select('#album-desc-more')[0].get_text().replace('\n', '').replace(',', ',')
else:
text = '无'
# 获取歌单收藏量
collection = soup.select('#content-operation i')[1].get_text().replace('(', '').replace(')', '')
# 歌单播放量
play = soup.select('.s-fc6')[0].get_text()
# 歌单内歌曲数
songs = soup.select('#playlist-track-count')[0].get_text()
# 歌单评论数
comments = soup.select('#cnt_comment_count')[0].get_text()
# 输出歌单详情页信息
print(title, tag, text, collection, play, songs, comments)
# 将详情页信息写入CSV文件中
with open('music_message.csv', 'a+', encoding='utf-8') as f:
# f.write(title + '/' + tag + '/' + text + '/' + collection + '/' + play + '/' + songs + '/' + comments + '\n')
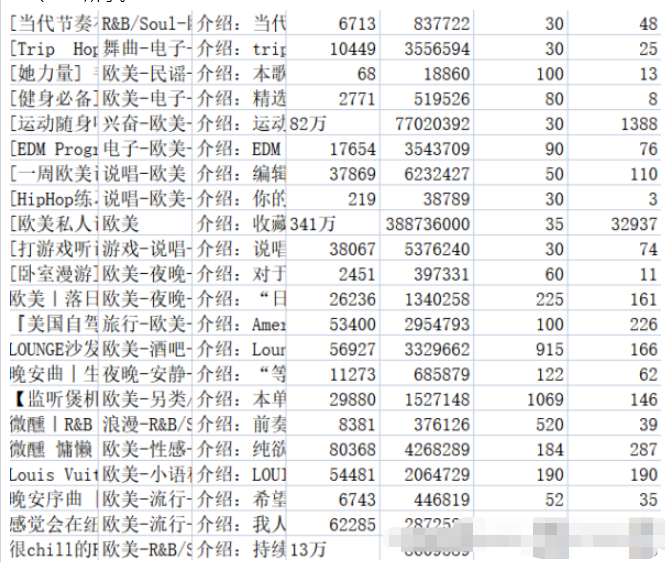
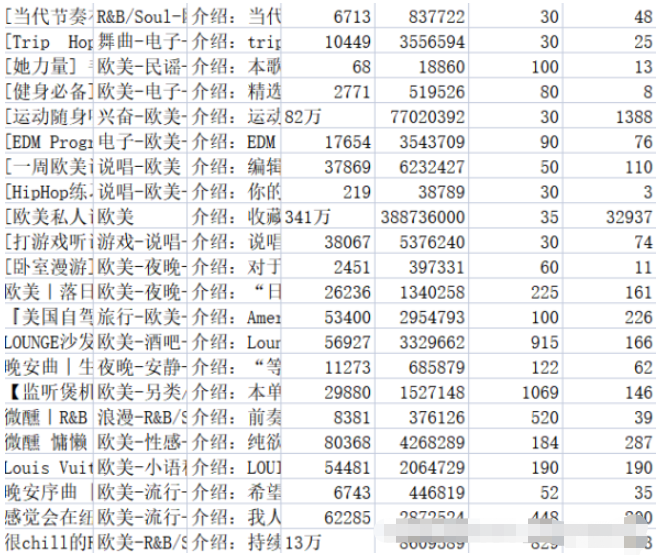
f.write(title + ',' + tag + ',' + text + ',' + collection + ',' + play + ',' + songs + ',' + comments + '\n')Save relevant content into the corresponding .csv file. The music_message.csv file stores the name, tag, introduction, collection volume, playback volume, number of songs included in the playlist, and the number of comments of the playlist. The address, title, play volume and contributor name of the playlist details page are all stored in the playlist.csv file. The results are shown in Figures 2-1 and 2-2.
Regarding data cleaning, in fact, it has already been done in the process of capturing data in the previous part. I have done some work, including: empty playlist information returned by the background, deduplication of duplicate data, etc. In addition, some cleaning needs to be done: unifying the comment volume data into a unified format, etc.
Add the number of comments to the data with "ten thousand", replace "ten thousand" with "0000" to facilitate subsequent data analysis, and add the number of comments to Data with errors in data statistics are filled with "0" and will not participate in subsequent statistics.
df['collection'] = df['collection'].astype('string').str.strip()
df['collection'] = [int(str(i).replace('万','0000')) for i in df['collection']]
df['text'] = [str(i)[3:] for i in df['text']]
df['comments'] = [0 if '评论' in str(i).strip() else int(i) for i in df['comments']]
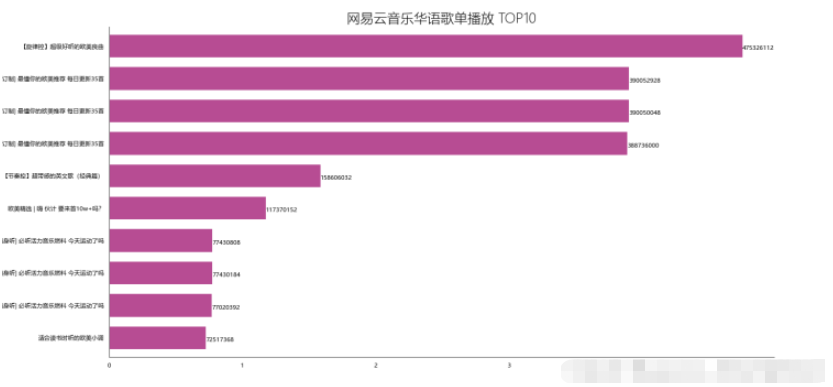
df_play = df[['title','play']].sort_values('play',ascending=False)
df_play[:10]
df_play = df_play[:10]
_x = df_play['title'].tolist()
_y = df_play['play'].tolist()
df_play = get_matplot(x=_x,y=_y,chart='barh',title='网易云音乐华语歌单播放 TOP10',ha='left',size=8,color=color[0])
df_play
df_col = df[['title','collection']].sort_values('collection',ascending=False)
df_col[:10]
df_col = df_col[:10]
_x = df_col['title'].tolist()
_y = df_col['collection'].tolist()
df_col = get_matplot(x=_x,y=_y,chart='barh',title='网易云音乐华语歌单收藏 TOP10',ha='left',size=8,color=color[1])
df_col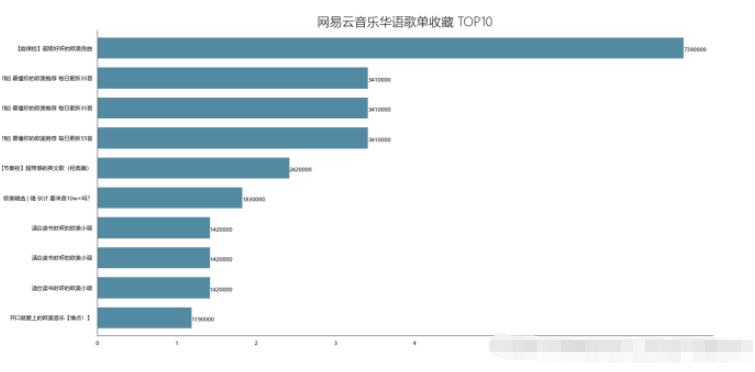
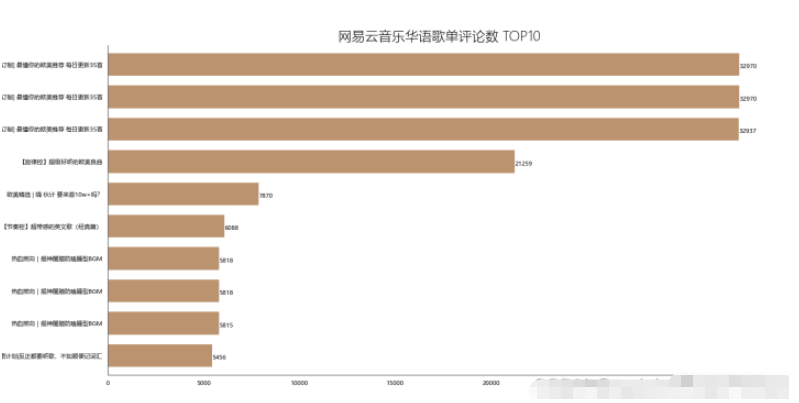
df_com = df[['title','comments']].sort_values('comments',ascending=False)
df_com[:10]
df_com = df_com[:10]
_x = df_com['title'].tolist()
_y = df_com['comments'].tolist()
df_com = get_matplot(x=_x,y=_y,chart='barh',title='网易云音乐华语歌单评论数 TOP10',ha='left',size=8,color=color[2])
df_com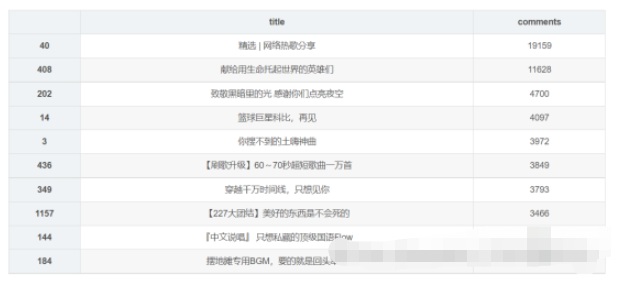
df_songs = np.log(df['songs'])
df_songs
df_songs = get_matplot(x=0,y=df_songs,chart='hist',title='华语歌单歌曲收录分布情况',ha='left',size=10,color=color[3])
df_songs
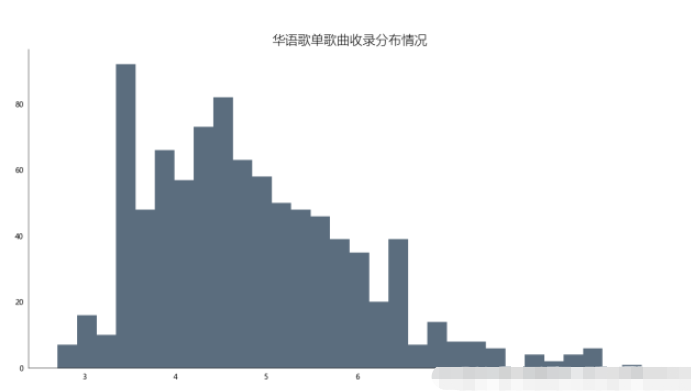
通过对柱形图分析发现,歌单对歌曲的收录情况多数集中在20-60首歌曲,至多超过80首,也存在空歌单现象,但绝大多数歌单收录歌曲均超过10首左右。这次可视化分析将有助于后续创作者更好地收录歌曲到自己的创作歌单中。也能够更受大众欢迎。
def get_tag(df):
    df = df['tag'].str.split('-')
    datalist = list(set(x for data in df for x in data))
    return  datalist
df_tag = get_tag(df)
# df_tag
def get_lx(x,i):
    if i in str(x):
        return 1
    else:
        return 0
for i in list(df_tag):#这里的df['all_category'].unique()也可以自己用列表构建,我这里是利用了前面获得的
    df[i] = df['tag'].apply(get_lx,i=f'{i}')
# df.head()
Series = df.iloc[:,7:].sum().sort_values(0,ascending=False)
df_tag = [tag for tag in zip(Series.index.tolist(),Series.values.tolist())]
df_tag[:10]
df_iex = [index for index in Series.index.tolist()][:20]
df_tag = [tag for tag in Series.values.tolist()][:20]
df_tagiex = get_matplot(x=df_iex,y=df_tag,chart='plot',title='网易云音乐华语歌单标签图',size=10,ha='center',color=color[3])
df_tagiex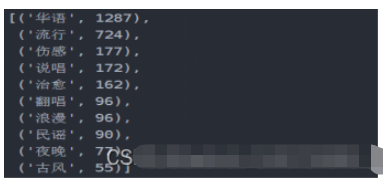
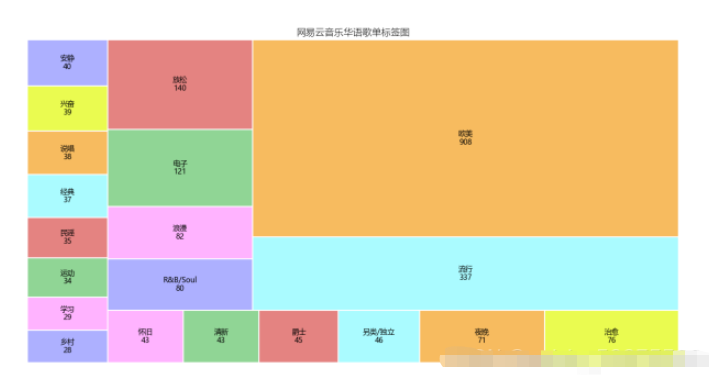
可以通过此标签图看出歌单的风格,可以分析出目前的主流歌曲的情感,以及大众的需求,也网易云音乐用户的音乐偏好,据此可以看出,网易云音乐用户,在音乐偏好上比较多元化:国内流行、欧美流行、电子、 等各种风格均有涉及。
df_user = pd.read_csv('playlist.csv',encoding="unicode_escape",header=0,names=['url','title','play','user'],sep=',')
df_user.shape
df_user = df_user.iloc[:,1:]
df_user['count'] = 0
df_user = df_user.groupby('user',as_index=False)['count'].count()
df_user = df_user.sort_values('count',ascending=False)[:10]
df_user
df_user = df_user[:10]
names = df_user['user'].tolist()
nums = df_user['count'].tolist()
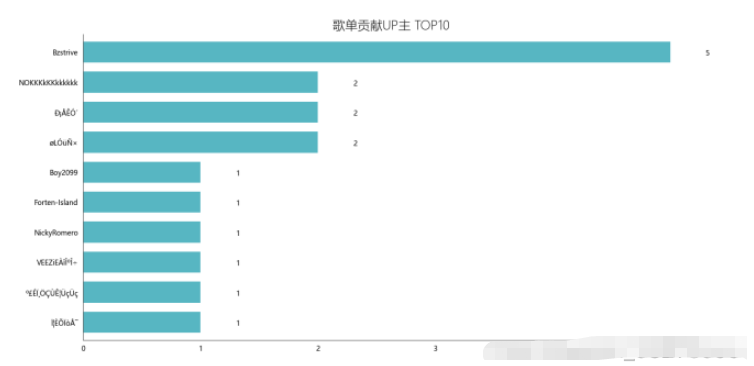
df_u = get_matplot(x=names,y=nums,chart='barh',title='歌单贡献UP主 TOP10',ha='left',size=10,color=color[4])
df_u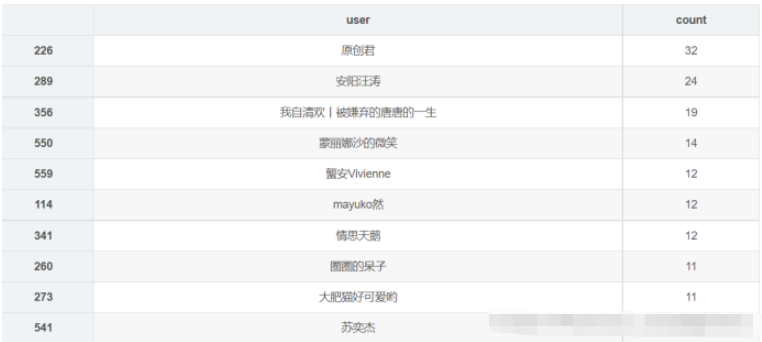
import wordcloud
import pandas as pd
import numpy as np
from PIL import Image
data = pd.read_excel('music_message.xlsx')
#根据播放量排序,只取前五十个
data = data.sort_values('play',ascending=False).head(50)

#font_path指明用什么样的字体风格,这里用的是电脑上都有的微软雅黑
w1 = wordcloud.WordCloud(width=1000,height=700,
                         background_color='black',
                         font_path='msyh.ttc')
txt = "\n".join(i for i in data['title'])
w1.generate(txt)
w1.to_file('F:\\词云.png')
为了简化代码,构建了通用函数
get_matplot(x,y,chart,title,ha,size,color)
x表示充当x轴数据;
y表示充当y轴数据;
chart表示图标类型,这里分为三种barh、hist、squarify.plot;
ha表示文本相对朝向;
size表示字体大小;
color表示图表颜色;
def get_matplot(x,y,chart,title,ha,size,color):
    # 设置图片显示属性,字体及大小
    plt.rcParams['font.sans-serif'] = ['Microsoft YaHei']
    plt.rcParams['font.size'] = size
    plt.rcParams['axes.unicode_minus'] = False
    # 设置图片显示属性
    fig = plt.figure(figsize=(16, 8), dpi=80)
    ax = plt.subplot(1, 1, 1)
    ax.patch.set_color('white')
    # 设置坐标轴属性
    lines = plt.gca()
    # 设置显示数据
    if x ==0:
        pass
    else:
        x.reverse()
        y.reverse()
        data = pd.Series(y, index=x)
    # 设置坐标轴颜色
    lines.spines['right'].set_color('none')
    lines.spines['top'].set_color('none')
    lines.spines['left'].set_color((64/255, 64/255, 64/255))
    lines.spines['bottom'].set_color((64/255, 64/255, 64/255))
    # 设置坐标轴刻度
    lines.xaxis.set_ticks_position('none')
    lines.yaxis.set_ticks_position('none')
    if chart == 'barh':
        # 绘制柱状图,设置柱状图颜色
        data.plot.barh(ax=ax, width=0.7, alpha=0.7, color=color)
        # 添加标题,设置字体大小
        ax.set_title(f'{title}', fontsize=18, fontweight='light')
        # 添加歌曲出现次数文本
        for x, y in enumerate(data.values):
            plt.text(y+0.3, x-0.12, '%s' % y, ha=f'{ha}')
    elif chart == 'hist':
        # 绘制直方图,设置柱状图颜色
        ax.hist(y, bins=30, alpha=0.7, color=(21/255, 47/255, 71/255))
        # 添加标题,设置字体大小
        ax.set_title(f'{title}', fontsize=18, fontweight='light')
    elif chart == 'plot':
        colors = ['#adb0ff', '#ffb3ff', '#90d595', '#e48381', '#aafbff', '#f7bb5f', '#eafb50',
         '#adb0ff', '#ffb3ff', '#90d595', '#e48381', '#aafbff', '#f7bb5f', '#eafb50',
         '#adb0ff', '#ffb3ff', '#90d595', '#e48381', '#aafbff', '#f7bb5f', '#eafb50',
         '#adb0ff', '#ffb3ff', '#90d595', '#e48381', '#aafbff', '#f7bb5f', '#eafb50',
         '#adb0ff', '#ffb3ff', '#90d595', '#e48381', '#aafbff', '#f7bb5f', '#eafb50',
          '#adb0ff', '#ffb3ff', '#90d595', '#e48381', '#aafbff', '#f7bb5f', '#eafb50',
          '#adb0ff', '#ffb3ff', '#90d595', '#e48381', '#aafbff']
        plot = squarify.plot(sizes=y, label=x, color=colors, alpha=1, value=y, edgecolor='white', linewidth=1.5)
        # 设置标签大小为1
        plt.rc('font', size=6)
        # 设置标题大小
        plot.set_title(f'{title}', fontsize=13, fontweight='light')
        # 除坐标轴
        plt.axis('off')
        # 除上边框和右边框刻度
        plt.tick_params(top=False, right=False)
    # 显示图片
    plt.show()
#构建color序列
color = [(153/255, 0/255, 102/255),(8/255, 88/255, 121/255),(160/255, 102/255, 50/255),(136/255, 43/255, 48/255),(16/255, 152/255, 168/255),(153/255, 0/255, 102/255)]
The above is the detailed content of How to use Python to analyze and visualize NetEase Cloud playlist data. For more information, please follow other related articles on the PHP Chinese website!