

本期利用 python 的 pyecharts 可视化库绘制北京市历史天气数据,看看历史高温、历史低温分布以及白天、夜晚的风力、风向分布等情况,希望对大家有所帮助,如有疑问或者需要改进的地方可以联系小编。
涉及到的库:
Pandas — 数据处理
Pyecharts — 数据可视化
import pandas as pd
from pyecharts.charts import Line
from pyecharts.charts import Bar
from pyecharts.charts import Scatter
from pyecharts.charts import Pie
from pyecharts.charts import EffectScatter
from pyecharts.charts import Calendar
from pyecharts.charts import Polar
from pyecharts import options as opts
import warnings
warnings.filterwarnings('ignore')2.1 读取数据
df_weather = pd.read_excel('./2018-2022年天气数据.xlsx')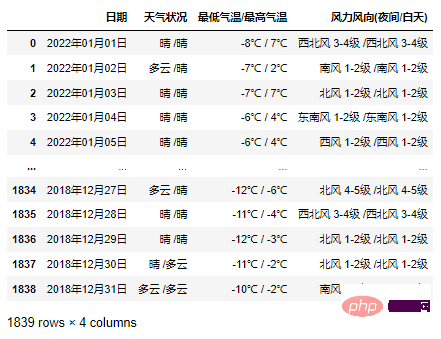
2.2 处理最低气温最高气温数据
df_weather_1 = df_weather.copy()
df_weather_1[['最低气温','最高气温']] = df_weather_1['最低气温/最高气温'].str.split(' / ',expand=True)
df_weather_1['最低气温'] = df_weather_1['最低气温'].str[:-2]
df_weather_1['最高气温'] = df_weather_1['最高气温'].str[:-1]
df_weather_1['最低气温'] = df_weather_1['最低气温'].astype('int')
df_weather_1['最高气温'] = df_weather_1['最高气温'].astype('int')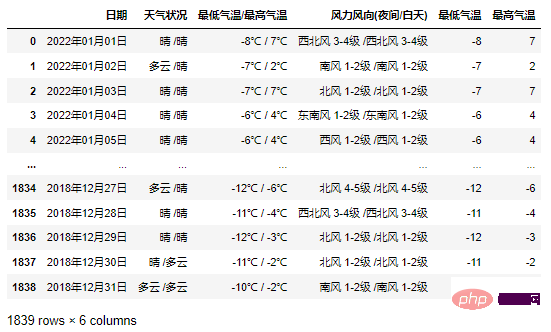
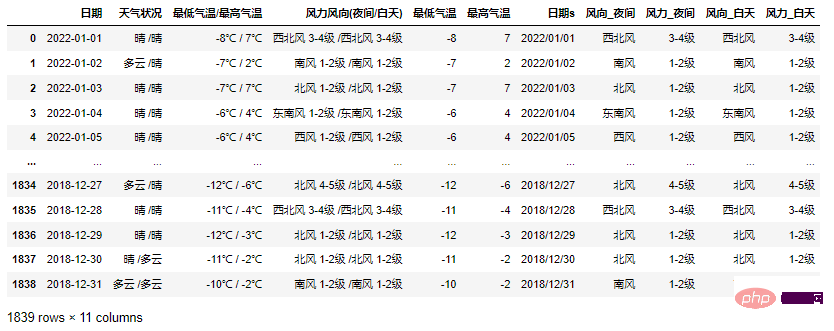
2.3 处理日期数据
df_weather_1['日期'] = pd.to_datetime(df_weather_1['日期'],format='%Y年%m月%d日')
df_weather_1['日期s'] = df_weather_1['日期'].dt.strftime('%Y/%m/%d')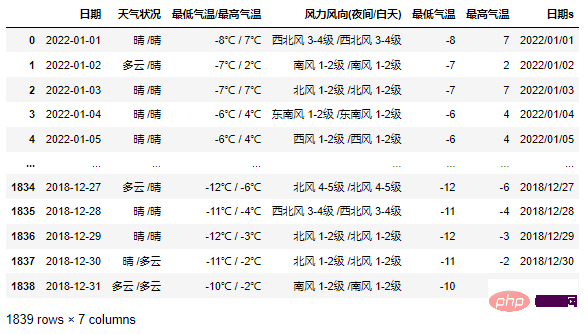
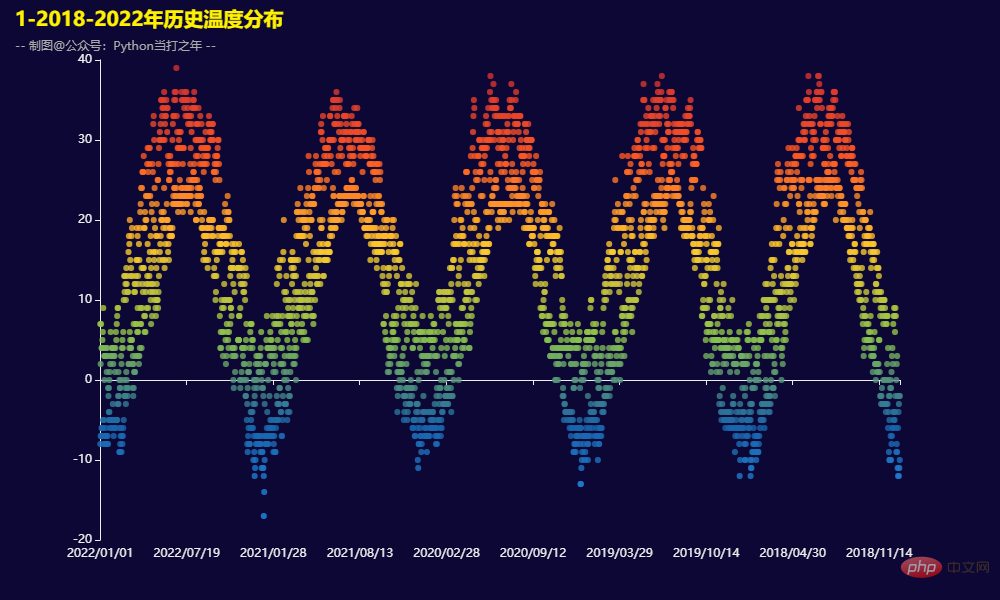
def get_scatter():
    scatter = (
        Scatter()
        .add_xaxis(x_data)
        .add_yaxis("最低气温", y_data1)
        .add_yaxis("最高气温", y_data2)
        .set_global_opts(
            legend_opts=opts.LegendOpts(is_show=False),
            visualmap_opts=opts.VisualMapOpts(
                is_show=False,
                range_color=range_color
            ),
            title_opts=opts.TitleOpts(
                title='1-2018-2022年历史温度分布',
                subtitle='-- 制图@公众号:Python当打之年 --',
                pos_top='1%',
                pos_left="1%",
            )
        )
    )
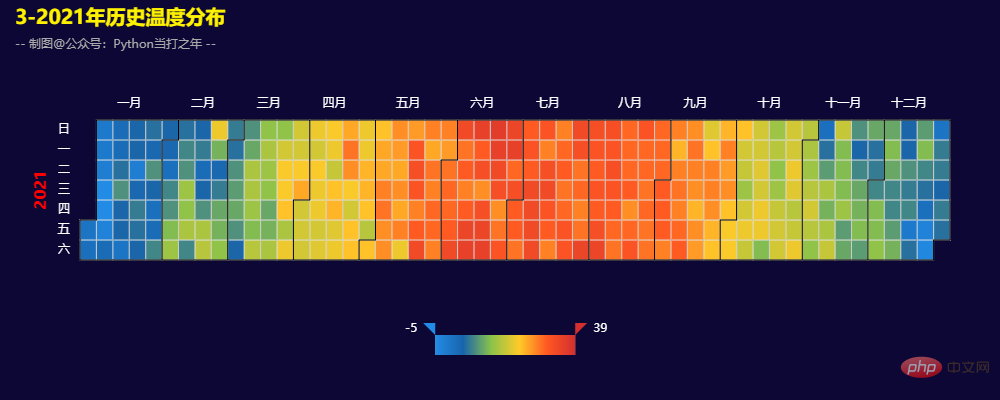
def get_calendar():
    calendar = (
        Calendar()
        .add('',
             data_21,
             calendar_opts=opts.CalendarOpts(
                 pos_right='5%',
                 range_='2021',
                daylabel_opts=opts.CalendarDayLabelOpts(name_map='cn'),
                monthlabel_opts=opts.CalendarMonthLabelOpts(name_map='cn')
             ),
        )
        .set_global_opts(
            title_opts=opts.TitleOpts(
                title='3-2021年历史温度分布',
                subtitle='-- 制图@公众号:Python当打之年 --',
                pos_top='1%',
                pos_left="1%",
            ),
            visualmap_opts=opts.VisualMapOpts(
                range_color=range_color,
            )
        )
    )

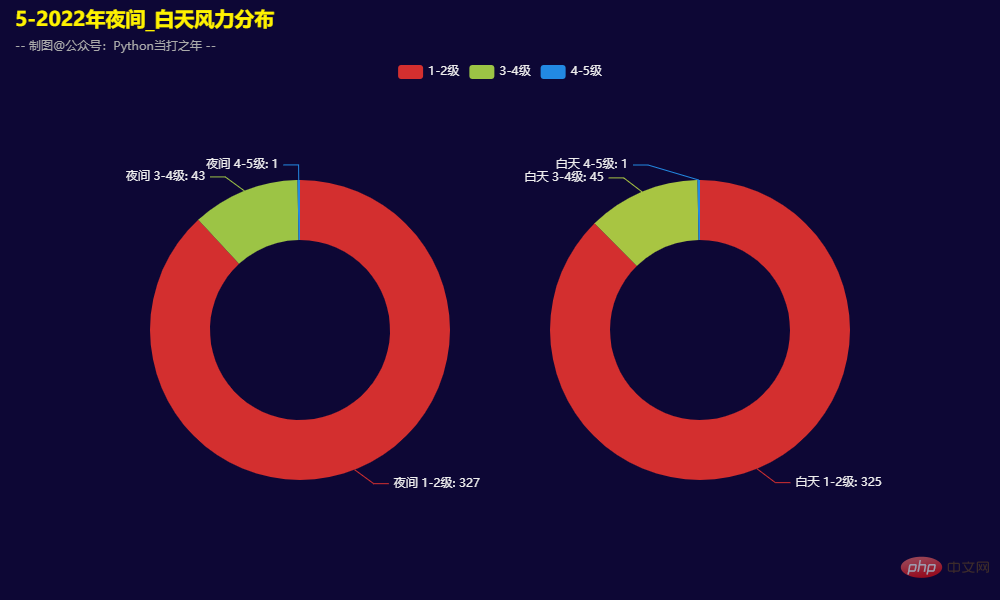
3.5 2022年夜间_白天风力分布
def get_pie():
    pie = (
        Pie()
        .add(
            "",
            [list(z) for z in zip(x_data, y_data1)],
            radius=["30%", "50%"],
            center=["30%", "55%"],
        )
        .add(
            "",
            [list(z) for z in zip(x_data, y_data2)],
            radius=["30%", "50%"],
            center=["70%", "55%"],
        )
        .set_global_opts(
            title_opts=opts.TitleOpts(
                title='5-2022年夜间_白天风力分布',
                subtitle='-- 制图@公众号:Python当打之年 --',
                pos_top='1%',
                pos_left="1%",
            ),
            legend_opts=opts.LegendOpts(pos_top='10%'),
            visualmap_opts=opts.VisualMapOpts(
                is_show=False,
                range_color=range_color
            ),
        )
    )
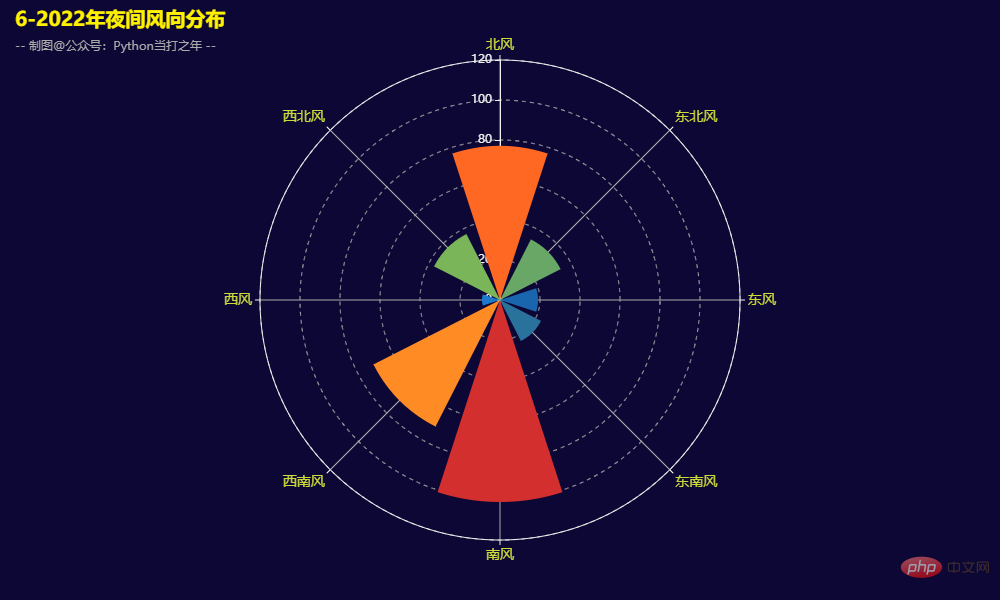
def get_polor():
    polor = (
        Polar()
        .add("", values,type_="bar")
        .set_global_opts(
            legend_opts=opts.LegendOpts(is_show=False),
            visualmap_opts=opts.VisualMapOpts(
                is_show=False,
                range_color=range_color
            ),
            title_opts=opts.TitleOpts(
                title='6-2022年夜间风向分布',
                subtitle='-- 制图@公众号:Python当打之年 --',
                pos_top='1%',
                pos_left="1%",
            ),
        )
    )
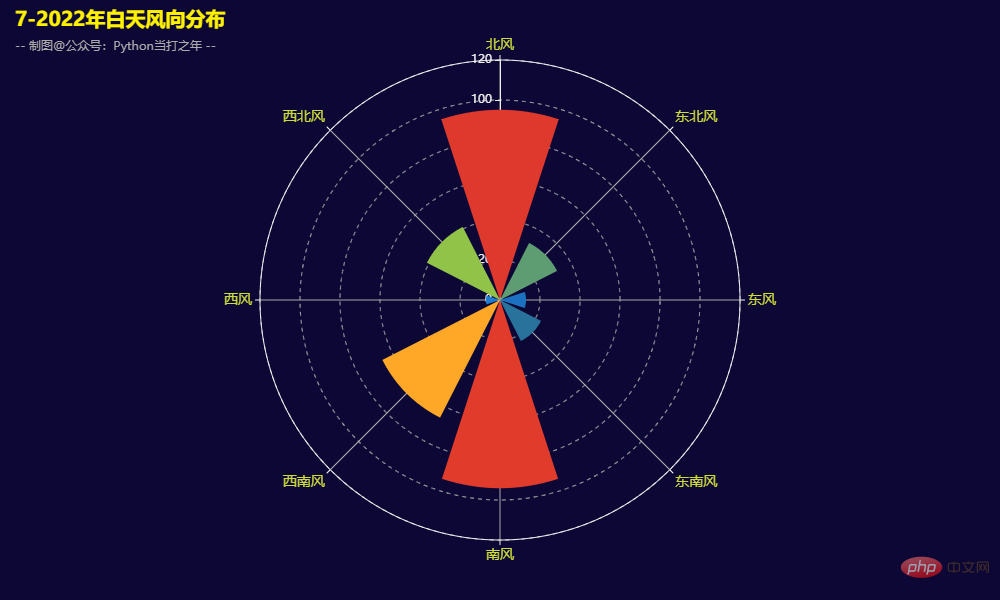
3.7 2022年白天风向分布
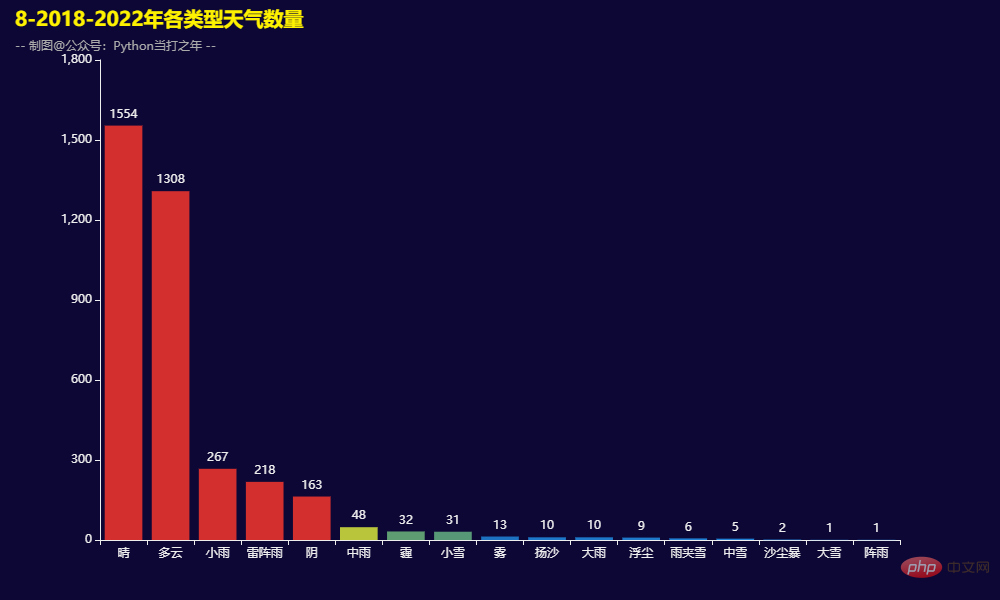
3.8 2018-2022年各类型天气数量
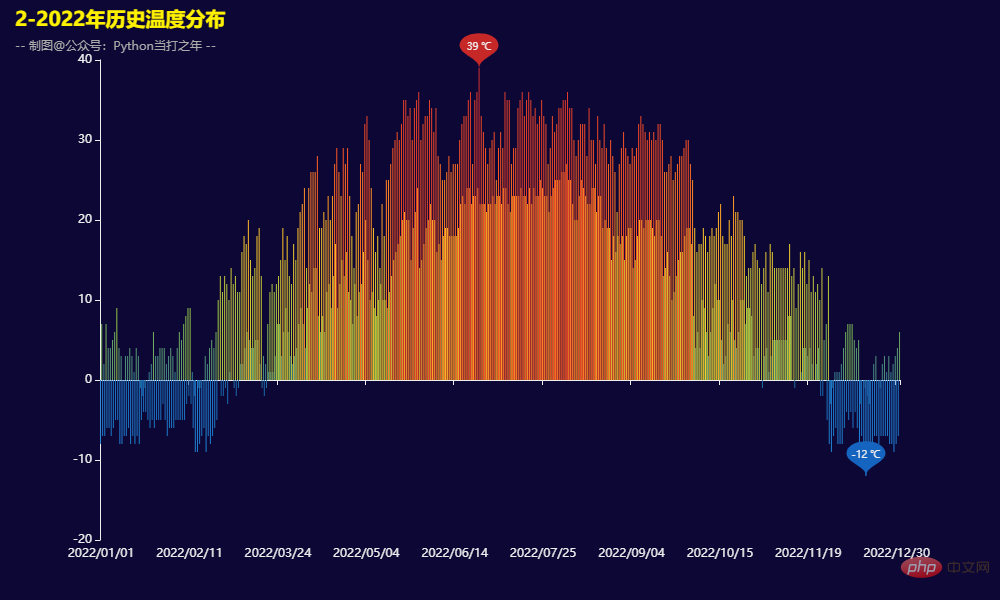
def get_bar():
    bar = (
        Bar()
        .add_xaxis(x_data)
        .add_yaxis("",y_data)
        .set_global_opts(
            visualmap_opts=opts.VisualMapOpts(
                is_show=False,
                range_color=range_color
            ),
            legend_opts=opts.LegendOpts(is_show=False),
            title_opts=opts.TitleOpts(
                title='8-2018-2022年各类型天气数量',
                subtitle='-- 制图@公众号:Python当打之年 --',
                pos_top='1%',
                pos_left="1%",
            ),
        )
    )
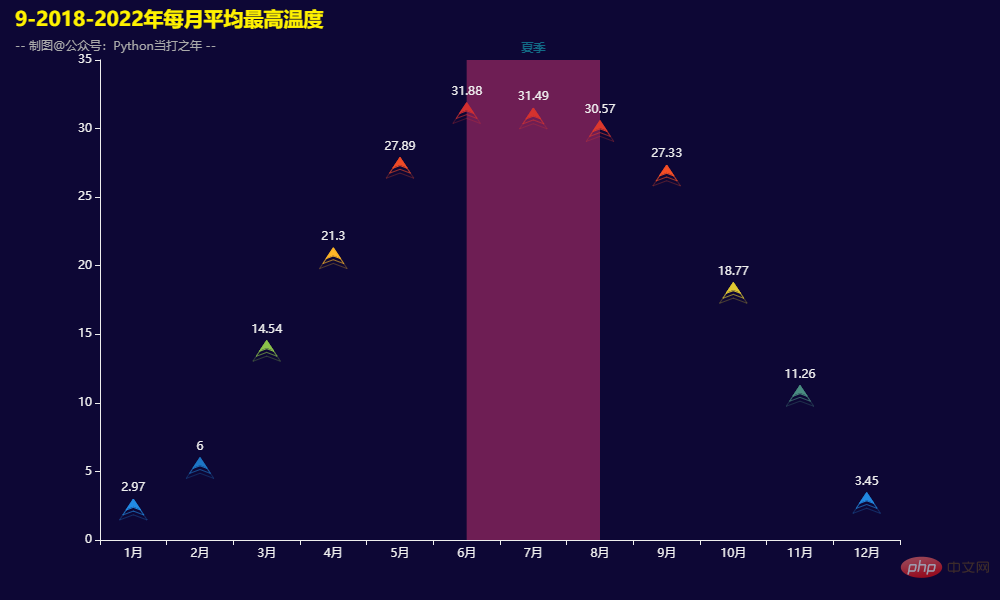
3.9 2018-2022年每月平均最高温度
위 내용은 Pandas+Pyecharts | 北京近五年历史天气数据可视化의 상세 내용입니다. 자세한 내용은 PHP 중국어 웹사이트의 기타 관련 기사를 참조하세요!


![[웹 프런트엔드] Node.js 빠른 시작](https://img.php.cn/upload/course/000/000/067/662b5d34ba7c0227.png)


