Pandas는 Python에서 매우 일반적으로 사용되는 데이터 처리 도구이며 사용하기 매우 편리합니다. NumPy 배열 구조를 기반으로 구축되었으므로 많은 작업이 NumPy 또는 Pandas와 함께 제공되는 확장 모듈을 통해 작성됩니다. 이러한 모듈은 Cython으로 작성되고 C로 컴파일되며 C에서 실행되므로 처리 속도가 보장됩니다.오늘 우리는 그 힘을 경험해보겠습니다.
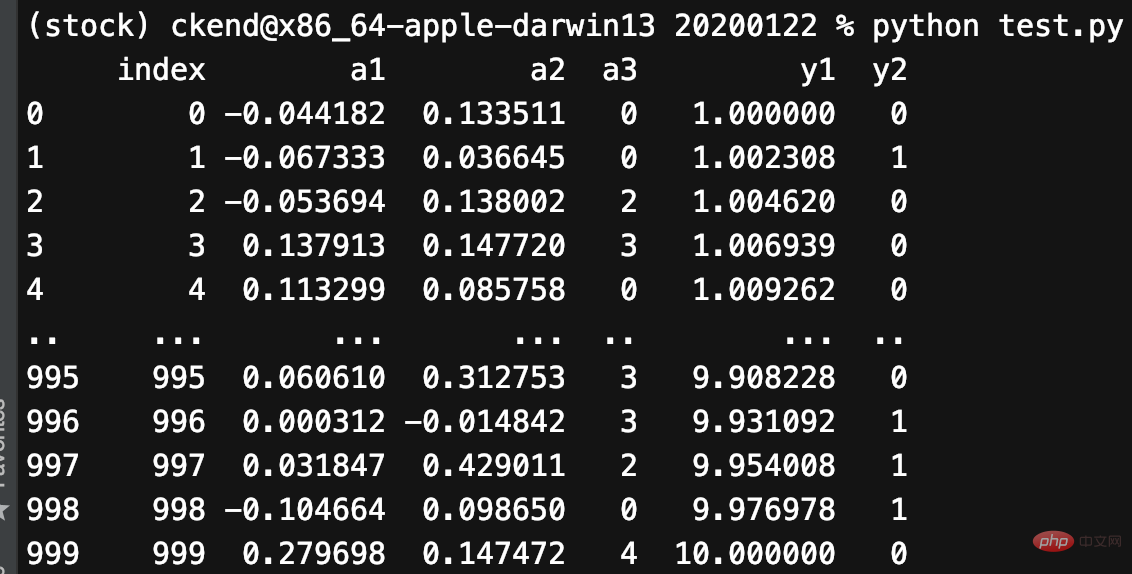
1. 데이터 생성mu1, sigma1 = 0, 0.1 mu2, sigma2 = 0.2, 0.2 n = 1000df = pd.DataFrame( { "a1": pd.np.random.normal(mu1, sigma1, n), "a2": pd.np.random.normal(mu2, sigma2, n), "a3": pd.np.random.randint(0, 5, n), "y1": pd.np.logspace(0, 1, num=n), "y2": pd.np.random.randint(0, 2, n), } )
2. 이미지 그리기
2. 핵심 사항 표시
import matplotlib.pyplot as plt ax = df.y1.plot() ax.axhline(6, color="red", linestyle="--") ax.axvline(775, color="red", linestyle="--") plt.show()
또한 하나의 차트에 표시되는 테이블 수를 사용자 정의할 수 있습니다.
fig, ax = plt.subplots(2, 2, figsize=(14,7)) df.plot(x="index", y="y1", ax=ax[0, 0]) df.plot.scatter(x="index", y="y2", ax=ax[0, 1]) df.plot.scatter(x="index", y="a3", ax=ax[1, 0]) df.plot(x="index", y="a1", ax=ax[1, 1]) plt.show()

3. 히스토그램 그리기
df[["a1", "a2"]].plot(bins=30, kind="hist") plt.show()
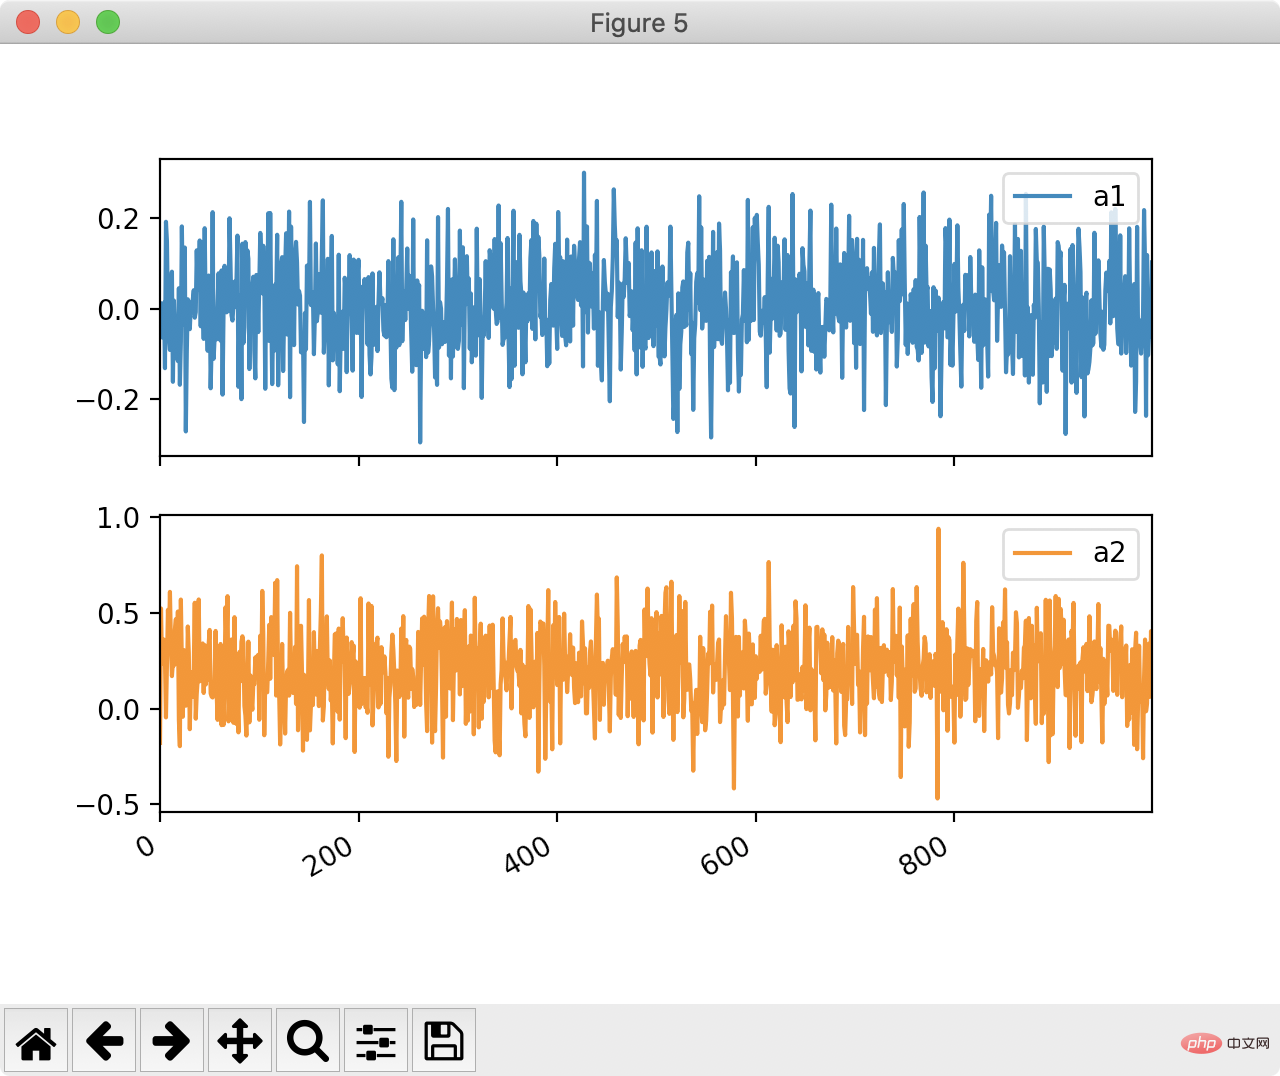
df[["a1", "a2"]].plot(bins=30, kind="hist", subplots=True) plt.show()
 물론 선 차트 생성은 더 이상 그려지지 않습니다.
df[['a1', 'a2']].plot(by=df.y2, subplots=True) plt.show()

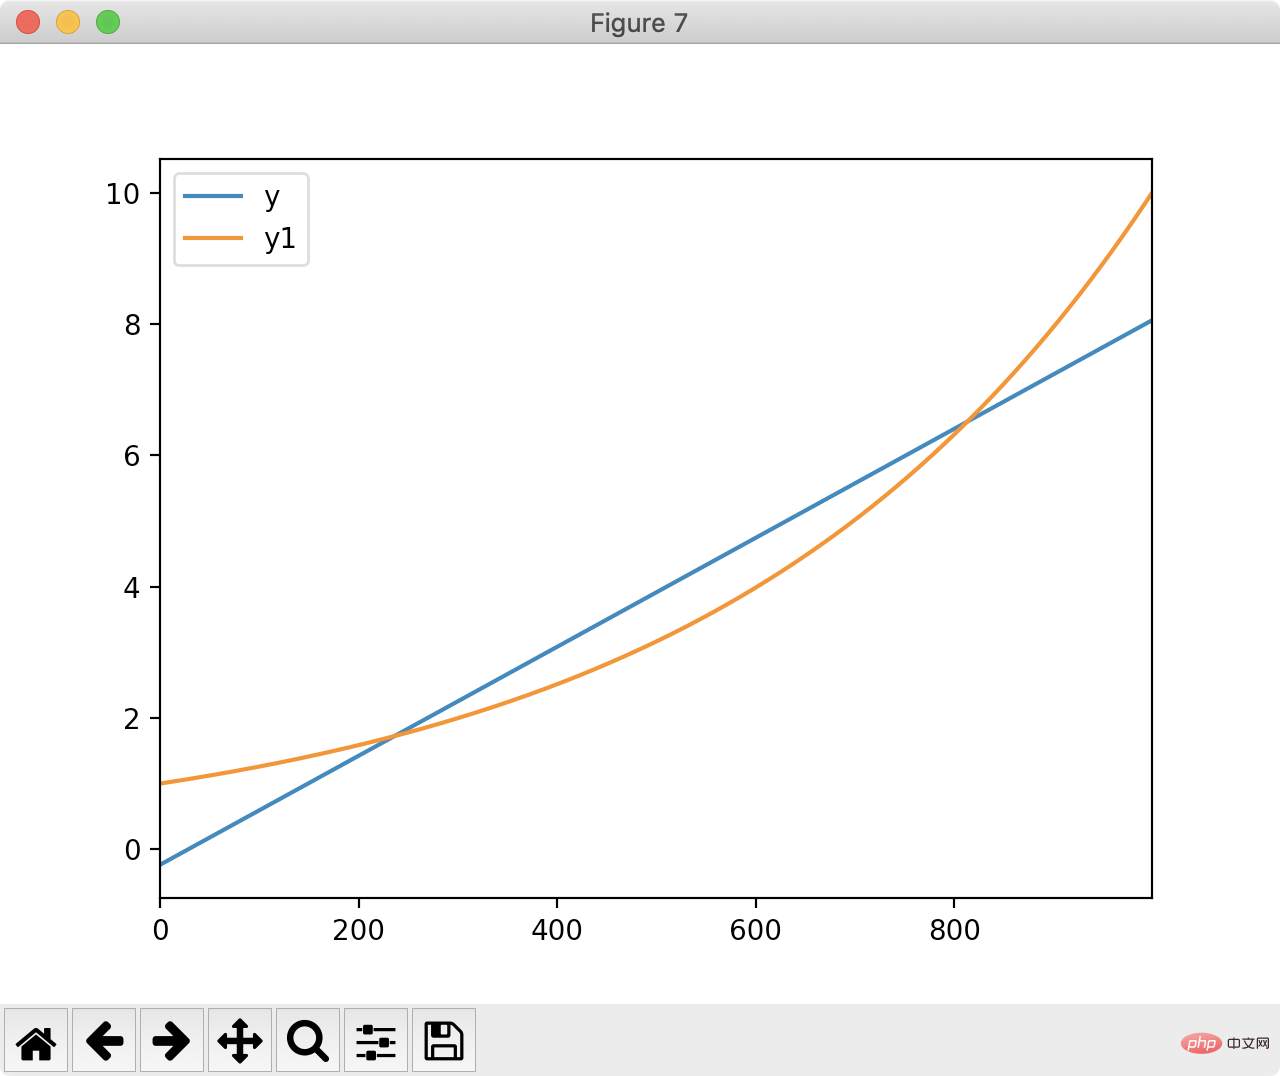
4. 선형 피팅
df['ones'] = pd.np.ones(len(df)) m, c = pd.np.linalg.lstsq(df[['index', 'ones']], df['y1'], rcond=None)[0]
df['y'] = df['index'].apply(lambda x: x * m + c) df[['y', 'y1']].plot() plt.show()
 읽어주셔서 감사합니다. 많은.
이 기사는 https://blog.csdn.net/u010751000/article/details/106735872

위 내용은 살펴볼 가치가 있는 Python의 효율적인 데이터 처리의 상세 내용입니다. 자세한 내용은 PHP 중국어 웹사이트의 기타 관련 기사를 참조하세요!