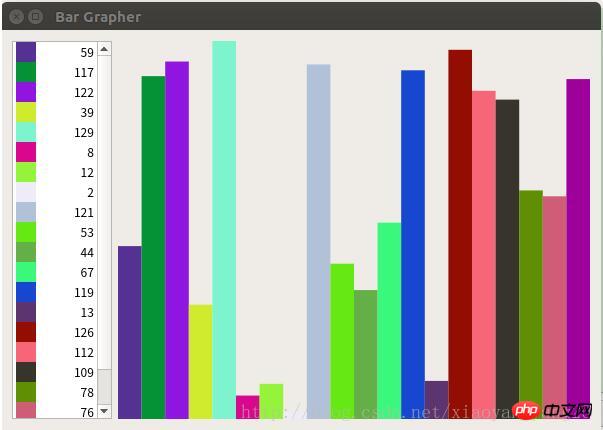
이 글은 주로 Python3+PyQt5에서 히스토그램을 구현하는 방법을 자세하게 소개하고 있습니다. 관심있는 친구들은 참고해 보세요
이 글은 Python3+pyqt5의 예제를 통해 Python Qt GUI 빠른 프로그래밍을 구현합니다.
#!/usr/bin/env python3

import random
import sys
from PyQt5.QtCore import (QAbstractListModel, QAbstractTableModel,
  QModelIndex, QSize, QTimer, QVariant, Qt,pyqtSignal)
from PyQt5.QtWidgets import (QApplication, QDialog, QHBoxLayout,
  QListView, QSpinBox, QStyledItemDelegate,QStyleOptionViewItem, QWidget)
from PyQt5.QtGui import QColor,QPainter,QPixmap

class BarGraphModel(QAbstractListModel):
 dataChanged=pyqtSignal(QModelIndex,QModelIndex)
 def __init__(self):
  super(BarGraphModel, self).__init__()
  self.__data = []
  self.__colors = {}
  self.minValue = 0
  self.maxValue = 0


 def rowCount(self, index=QModelIndex()):
  return len(self.__data)


 def insertRows(self, row, count):
  extra = row + count
  if extra >= len(self.__data):
   self.beginInsertRows(QModelIndex(), row, row + count - 1)
   self.__data.extend([0] * (extra - len(self.__data) + 1))
   self.endInsertRows()
   return True
  return False


 def flags(self, index):
  #return (QAbstractTableModel.flags(self, index)|Qt.ItemIsEditable)
  return (QAbstractListModel.flags(self, index)|Qt.ItemIsEditable)

 def setData(self, index, value, role=Qt.DisplayRole):
  row = index.row()
  if not index.isValid() or 0 > row >= len(self.__data):
   return False
  changed = False
  if role == Qt.DisplayRole:
   value = value
   self.__data[row] = value
   if self.minValue > value:
    self.minValue = value
   if self.maxValue < value:
    self.maxValue = value
   changed = True
  elif role == Qt.UserRole:
   self.__colors[row] = value
   #self.emit(SIGNAL("dataChanged(QModelIndex,QModelIndex)"),
   #   index, index)
   self.dataChanged[QModelIndex,QModelIndex].emit(index, index)
   changed = True
  if changed:
   #self.emit(SIGNAL("dataChanged(QModelIndex,QModelIndex)"),
    #   index, index)
   self.dataChanged[QModelIndex,QModelIndex].emit(index, index)
  return changed


 def data(self, index, role=Qt.DisplayRole):
  row = index.row()
  if not index.isValid() or 0 > row >= len(self.__data):
   return QVariant()
  if role == Qt.DisplayRole:
   return self.__data[row]
  if role == Qt.UserRole:
   return QVariant(self.__colors.get(row,
     QColor(Qt.red)))
  if role == Qt.DecorationRole:
   color = QColor(self.__colors.get(row,
     QColor(Qt.red)))
   pixmap = QPixmap(20, 20)
   pixmap.fill(color)
   return QVariant(pixmap)
  return QVariant()


class BarGraphDelegate(QStyledItemDelegate):

 def __init__(self, minimum=0, maximum=100, parent=None):
  super(BarGraphDelegate, self).__init__(parent)
  self.minimum = minimum
  self.maximum = maximum


 def paint(self, painter, option, index):
  myoption = QStyleOptionViewItem(option)
  myoption.displayAlignment |= (Qt.AlignRight|Qt.AlignVCenter)
  QStyledItemDelegate.paint(self, painter, myoption, index)


 def createEditor(self, parent, option, index):
  spinbox = QSpinBox(parent)
  spinbox.setRange(self.minimum, self.maximum)
  spinbox.setAlignment(Qt.AlignRight|Qt.AlignVCenter)
  return spinbox


 def setEditorData(self, editor, index):
  value = index.model().data(index, Qt.DisplayRole)
  editor.setValue(value)


 def setModelData(self, editor, model, index):
  editor.interpretText()
  model.setData(index, editor.value())


class BarGraphView(QWidget):

 WIDTH = 20

 def __init__(self, parent=None):
  super(BarGraphView, self).__init__(parent)
  self.model = None


 def setModel(self, model):
  self.model = model
  #self.connect(self.model,
  #  SIGNAL("dataChanged(QModelIndex,QModelIndex)"),
  #  self.update)
  self.model.dataChanged[QModelIndex,QModelIndex].connect(self.update)
  #self.connect(self.model, SIGNAL("modelReset()"), self.update)
  self.model.modelReset.connect(self.update)


 def sizeHint(self):
  return self.minimumSizeHint()


 def minimumSizeHint(self):
  if self.model is None:
   return QSize(BarGraphView.WIDTH * 10, 100)
  return QSize(BarGraphView.WIDTH * self.model.rowCount(), 100)


 def paintEvent(self, event):
  if self.model is None:
   return
  painter = QPainter(self)
  painter.setRenderHint(QPainter.Antialiasing)
  span = self.model.maxValue - self.model.minValue
  painter.setWindow(0, 0, BarGraphView.WIDTH * self.model.rowCount(),
       span)
  for row in range(self.model.rowCount()):
   x = row * BarGraphView.WIDTH
   index = self.model.index(row)
   color = QColor(self.model.data(index, Qt.UserRole))
   y = self.model.data(index)
   painter.fillRect(x, span - y, BarGraphView.WIDTH, y, color)


class MainForm(QDialog):

 def __init__(self, parent=None):
  super(MainForm, self).__init__(parent)

  self.model = BarGraphModel()
  self.barGraphView = BarGraphView()
  self.barGraphView.setModel(self.model)
  self.listView = QListView()
  self.listView.setModel(self.model)
  self.listView.setItemDelegate(BarGraphDelegate(0, 1000, self))
  self.listView.setMaximumWidth(100)
  self.listView.setEditTriggers(QListView.DoubleClicked|
          QListView.EditKeyPressed)
  layout = QHBoxLayout()
  layout.addWidget(self.listView)
  layout.addWidget(self.barGraphView, 1)
  self.setLayout(layout)

  self.setWindowTitle("Bar Grapher")
  QTimer.singleShot(0, self.initialLoad)


 def initialLoad(self):
  # Generate fake data
  count = 20
  self.model.insertRows(0, count - 1)
  for row in range(count):
   value = random.randint(1, 150)
   color = QColor(random.randint(0, 255), random.randint(0, 255),
       random.randint(0, 255))
   index = self.model.index(row)
   self.model.setData(index, value)
   self.model.setData(index, QVariant(color), Qt.UserRole)


app = QApplication(sys.argv)
form = MainForm()
form.resize(600, 400)
form.show()
app.exec_()실행 결과:

관련 권장 사항:
python3+PyQt5를 사용하여 문서 인쇄 기능 구현
위 내용은 python3+PyQt5는 히스토그램을 구현합니다.의 상세 내용입니다. 자세한 내용은 PHP 중국어 웹사이트의 기타 관련 기사를 참조하세요!