

Atlassian JIRA는 가장 인기 있는 이슈 추적기 및 프로젝트 관리 솔루션 중 하나입니다. 좋아할 수도 있고 싫어할 수도 있지만 어떤 회사의 소프트웨어 엔지니어로 채용되었다면 JIRA를 만날 확률이 높습니다.
진행 중인 프로젝트가 매우 활발하다면 다양한 유형의 수천 개의 JIRA 이슈가 있을 수 있습니다. 엔지니어 팀을 이끌고 있다면 JIRA에 저장된 데이터를 기반으로 프로젝트 진행 상황을 이해하는 데 도움이 되는 분석 도구에 관심이 있을 수 있습니다. JIRA에는 일부 보고 기능과 타사 플러그인이 통합되어 있습니다. 그러나 대부분은 매우 기본적인 것입니다. 예를 들어, 다소 유연한 "예측" 도구를 찾기가 어렵습니다.
프로젝트 규모가 클수록 통합 보고 도구에 대한 만족도가 낮아집니다. 어느 시점에서는 API를 사용하여 데이터를 추출, 조작 및 시각화하게 됩니다. 지난 15년 동안 JIRA를 사용하는 동안 저는 이 도메인 주변에서 다양한 프로그래밍 언어로 작성된 수십 개의 스크립트와 서비스를 보았습니다.
많은 일상적인 작업에는 일회성 데이터 분석이 필요할 수 있으므로 매번 서비스를 작성하는 것은 성과가 없습니다. JIRA를 데이터 소스로 취급하고 일반적인 데이터 분석 도구 벨트를 사용할 수 있습니다. 예를 들어 Jupyter를 사용하여 프로젝트의 최근 버그 목록을 가져오고, "기능"(분석에 유용한 속성) 목록을 준비하고, pandas를 활용하여 통계를 계산하고, scikit-learn을 사용하여 추세를 예측해 볼 수 있습니다. 이번 글에서는 그 방법을 설명드리고자 합니다.
여기에서는 JIRA의 클라우드 버전에 대해 이야기하겠습니다. 하지만 자체 호스팅 버전을 사용하는 경우 주요 개념은 거의 동일합니다.
먼저 REST API를 통해 JIRA에 액세스하려면 비밀 키를 생성해야 합니다. 그렇게 하려면 프로필 관리로 이동하세요 - https://id.atlassian.com/manage-profile/profile-and-visibility "보안" 탭을 선택하면 "API 토큰 생성 및 관리" 링크를 찾을 수 있습니다:
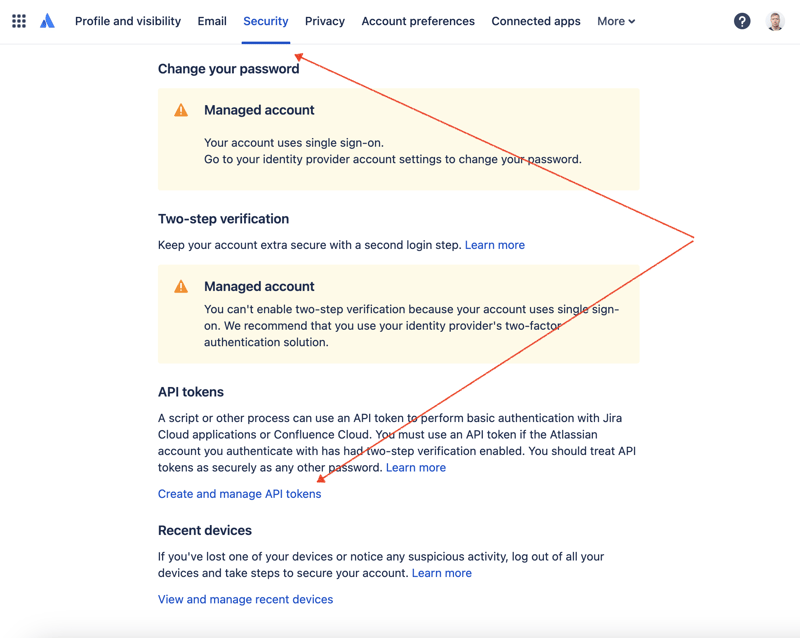
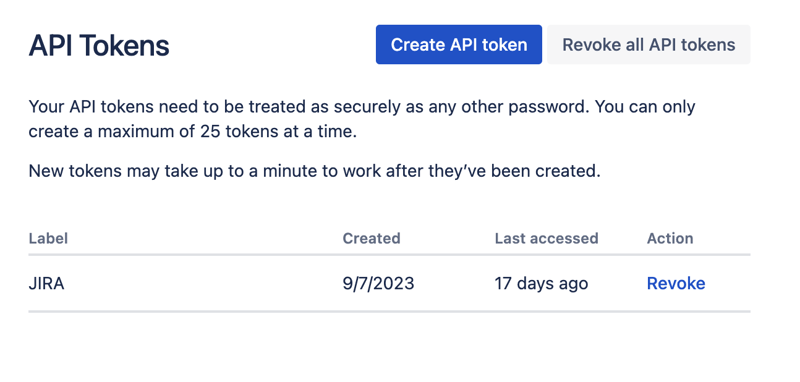
여기에서 새 API 토큰을 생성하고 안전하게 저장하세요. 나중에 이 토큰을 사용할 것입니다.
데이터세트를 사용하는 가장 편리한 방법 중 하나는 Jupyter를 활용하는 것입니다. 이 도구에 익숙하지 않더라도 걱정하지 마세요. 문제를 해결하기 위해 이를 사용하는 방법을 보여 드리겠습니다. 로컬 실험의 경우 JetBrains의 DataSpell을 사용하고 싶지만 온라인에서 무료로 사용할 수 있는 서비스가 있습니다. 데이터 과학자들 사이에서 가장 잘 알려진 서비스 중 하나는 Kaggle입니다. 그러나 해당 노트북에서는 API를 통해 JIRA에 액세스하기 위한 외부 연결을 허용하지 않습니다. 또 다른 매우 인기 있는 서비스는 Google의 Colab입니다. 이를 통해 원격 연결을 만들고 추가 Python 모듈을 설치할 수 있습니다.
JIRA에는 매우 사용하기 쉬운 REST API가 있습니다. 선호하는 HTTP 요청 방식을 사용하여 API를 호출하고 응답을 수동으로 구문 분석할 수 있습니다. 하지만 우리는 그 목적을 위해 훌륭하고 매우 인기 있는 jira 모듈을 활용할 것입니다.
모든 부분을 결합하여 솔루션을 생각해 봅시다.
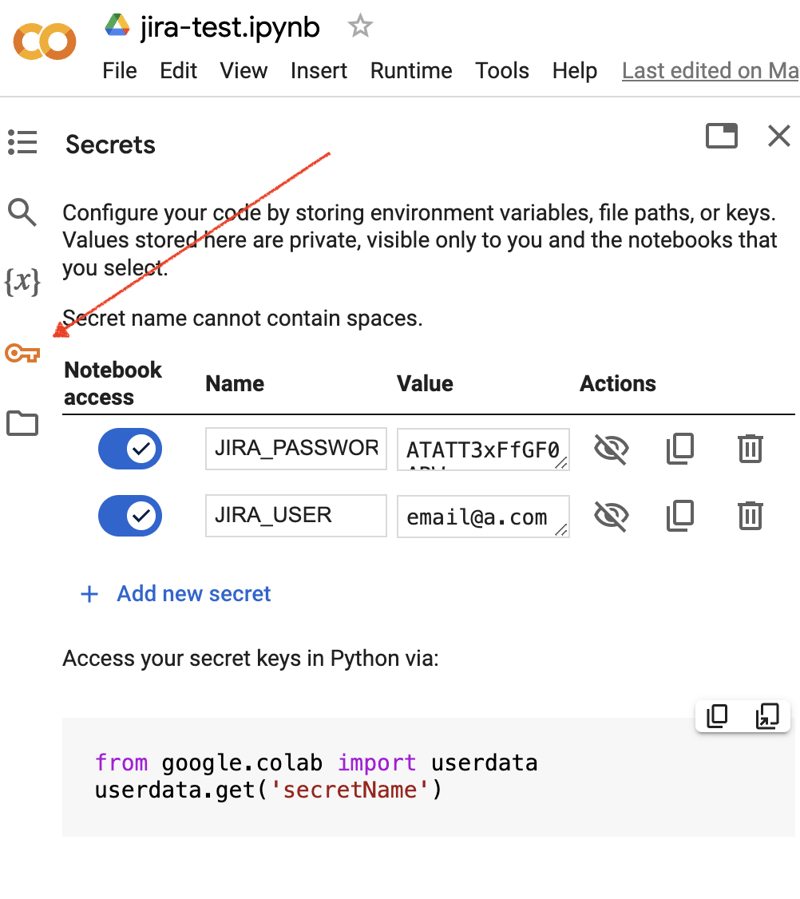
Google Colab 인터페이스로 이동하여 새 노트북을 만드세요. 노트북을 생성한 후에는 이전에 획득한 JIRA 자격 증명을 "비밀"로 저장해야 합니다. 왼쪽 도구 모음에서 "키" 아이콘을 클릭하여 해당 대화 상자를 열고 이름이 JIRA_USER 및 JIRA_PASSWORD인 두 개의 "비밀"을 추가합니다. 화면 하단에서 이러한 "비밀"에 액세스하는 방법을 확인할 수 있습니다.
다음은 JIRA 통합을 위한 추가 Python 모듈을 설치하는 것입니다. 노트북 셀 범위에서 쉘 명령을 실행하면 됩니다.
출력은 다음과 같아야 합니다.
"비밀"/자격 증명을 가져와야 합니다:
그리고 JIRA Cloud에 대한 연결을 확인하세요:
연결이 양호하고 자격 증명이 유효하면 비어 있지 않은 프로젝트 목록이 표시됩니다.
그러면 JIRA에 연결하여 데이터를 가져올 수 있습니다. 다음 단계는 Pandas로 분석할 데이터를 가져오는 것입니다. 일부 프로젝트에서 지난 몇 주 동안 해결된 문제 목록을 가져와 보겠습니다.
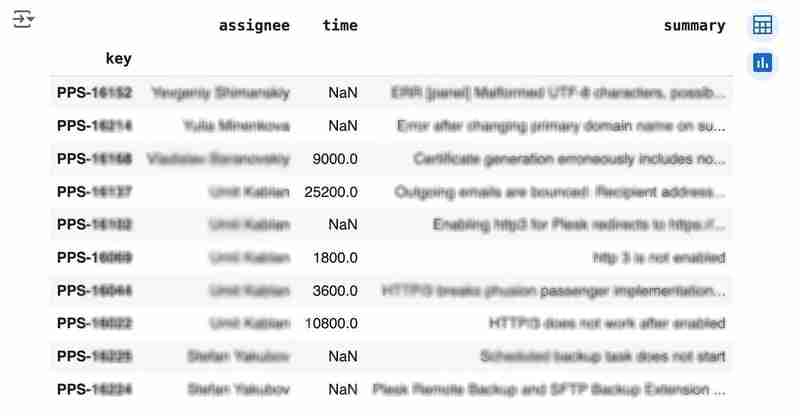
데이터세트를 Pandas 데이터 프레임으로 변환해야 합니다.
출력은 다음과 같을 수 있습니다.
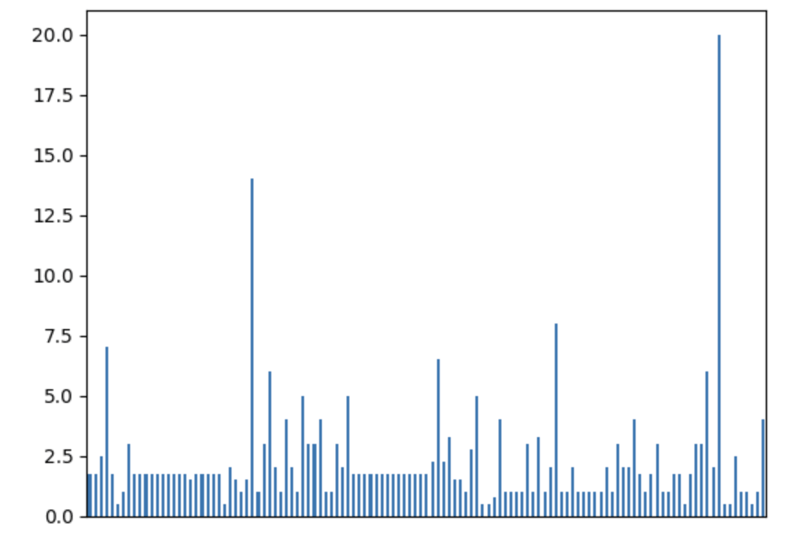
We would like to analyze how much time it usually takes to solve the issue. People are not ideal, so sometimes they forget to log the work. It brings a headache if you try to analyze such data using JIRA built-in tools. But it's not a problem for us to make some adjustments using pandas. For example, we can transform the "time" field from seconds into hours and replace the absent values with the median value (beware, dropna can be more suitable if there are a lot of gaps):
df['time'].fillna(df['time'].median(), inplace=True) df['time'] = df['time'] / 3600
We can easily visualize the distribution to find out anomalies:
df['time'].plot.bar(xlabel='', xticks=[])
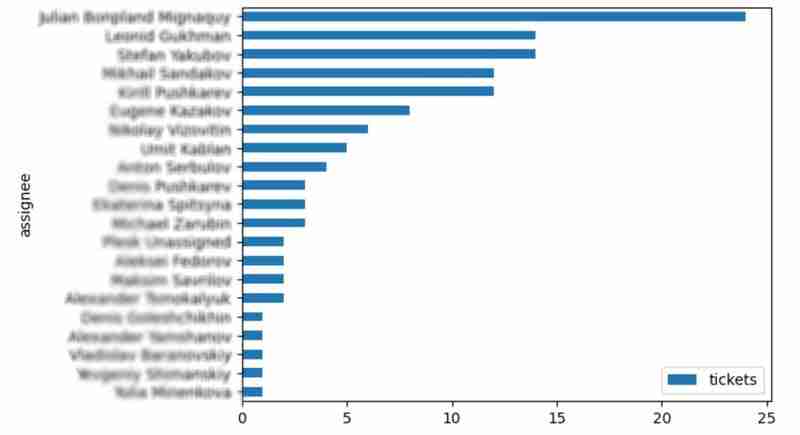
It is also interesting to see the distribution of solved problems by the assignee:
top_solvers = df.groupby('assignee').count()[['time']] top_solvers.rename(columns={'time': 'tickets'}, inplace=True) top_solvers.sort_values('tickets', ascending=False, inplace=True) top_solvers.plot.barh().invert_yaxis()
It may look like the following:
Let's try to predict the amount of time required to finish all open issues. Of course, we can do it without machine learning by using simple approximation and the average time to resolve the issue. So the predicted amount of required time is the number of open issues multiplied by the average time to resolve one. For example, the median time to solve one issue is 2 hours, and we have 9 open issues, so the time required to solve them all is 18 hours (approximation). It's a good enough forecast, but we might know the speed of solving depends on the product, team, and other attributes of the issue. If we want to improve the prediction, we can utilize machine learning to solve this task.
The high-level approach looks the following:
For the first step, we will use a dataset of tickets for the last 30 weeks. Some parts here are simplified for illustrative purposes. In real life, the amount of data for learning should be big enough to make a useful model (e.g., in our case, we need thousands of issues to be analyzed).
issues = jira.search_issues( f'project = PPS AND status IN (Resolved) AND created >= -30w', maxResults=False, fields='summary,issuetype,customfield_10718,customfield_10674,aggregatetimespent', ) closed_tickets = pd.DataFrame([{ 'key': issue.key, 'team': issue.fields.customfield_10718, 'product': issue.fields.customfield_10674, 'time': issue.fields.aggregatetimespent, } for issue in issues]) closed_tickets.set_index('key', inplace=True) closed_tickets['time'].fillna(closed_tickets['time'].median(), inplace=True) closed_tickets
In my case, it's something around 800 tickets and only two fields for "learning": "team" and "product."
The next step is to obtain our target dataset. Why do I do it so early? I want to clean up and do "feature engineering" in one shot for both datasets. Otherwise, the mismatch between the structures can cause problems.
issues = jira.search_issues( f'project = PPS AND status IN (Open, Reopened)', maxResults=False, fields='summary,issuetype,customfield_10718,customfield_10674', ) open_tickets = pd.DataFrame([{ 'key': issue.key, 'team': issue.fields.customfield_10718, 'product': issue.fields.customfield_10674, } for issue in issues]) open_tickets.set_index('key', inplace=True) open_tickets
Please notice we have no "time" column here because we want to predict it. Let's nullify it and combine both datasets to prepare the "features."
open_tickets['time'] = 0 tickets = pd.concat([closed_tickets, open_tickets]) tickets
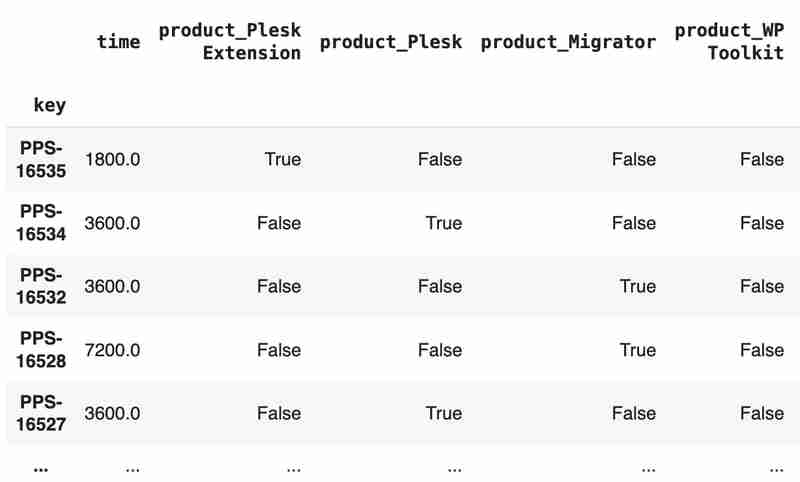
Columns "team" and "product" contain string values. One of the ways of dealing with that is to transform each value into separate fields with boolean flags.
products = pd.get_dummies(tickets['product'], prefix='product') tickets = pd.concat([tickets, products], axis=1) tickets.drop('product', axis=1, inplace=True) teams = pd.get_dummies(tickets['team'], prefix='team') tickets = pd.concat([tickets, teams], axis=1) tickets.drop('team', axis=1, inplace=True) tickets
The result may look like the following:
After the combined dataset preparation, we can split it back into two parts:
closed_tickets = tickets[:len(closed_tickets)] open_tickets = tickets[len(closed_tickets):][:]
Now it's time to train our model:
from sklearn.model_selection import train_test_split from sklearn.tree import DecisionTreeRegressor features = closed_tickets.drop(['time'], axis=1) labels = closed_tickets['time'] features_train, features_val, labels_train, labels_val = train_test_split(features, labels, test_size=0.2) model = DecisionTreeRegressor() model.fit(features_train, labels_train) model.score(features_val, labels_val)
And the final step is to use our model to make a prediction:
open_tickets['time'] = model.predict(open_tickets.drop('time', axis=1, errors='ignore')) open_tickets['time'].sum() / 3600
The final output, in my case, is 25 hours, which is higher than our initial rough estimation. This was a basic example. However, by using ML tools, you can significantly expand your abilities to analyze JIRA data.
Sometimes, JIRA built-in tools and plugins are not sufficient for effective analysis. Moreover, many 3rd party plugins are rather expensive, costing thousands of dollars per year, and you will still struggle to make them work the way you want. However, you can easily utilize well-known data analysis tools by fetching necessary information via JIRA API and go beyond these limitations. I spent so many hours playing with various JIRA plugins in attempts to create good reports for projects, but they often missed some important parts. Building a tool or a full-featured service on top of JIRA API also often looks like overkill. That's why typical data analysis and ML tools like Jupiter, pandas, matplotlib, scikit-learn, and others may work better here.

위 내용은 Pandas를 사용한 JIRA 분석의 상세 내용입니다. 자세한 내용은 PHP 중국어 웹사이트의 기타 관련 기사를 참조하세요!


![[웹 프런트엔드] Node.js 빠른 시작](https://img.php.cn/upload/course/000/000/067/662b5d34ba7c0227.png)


