


This article mainly introduces the effect of jQuery plug-in HighCharts to draw 2D pie charts. It analyzes the operation steps and related implementation techniques of using jQuery plug-in HighCharts to draw pie charts in the form of a complete example. It also comes with demo source code for readers to download for reference. Friends who need it You can refer to it, I hope it can help everyone.
The example in this article describes the effect of drawing a 2D pie chart with the jQuery plug-in HighCharts. Share it with everyone for your reference, the details are as follows:
1. Example code:
<!DOCTYPE html>
<html>
<head>
<meta charset="UTF-8">
<title>HighCharts 2D饼图</title>
<script type="text/javascript" src="js/jquery-1.7.2.min.js"></script>
<script type="text/javascript" src="js/highcharts.js"></script>
<script type="text/javascript">
$(function(){
$('#pieChart').highcharts({
chart: {
plotBackgroundColor: null,
plotBorderWidth: null,
plotShadow: false
},
title: {
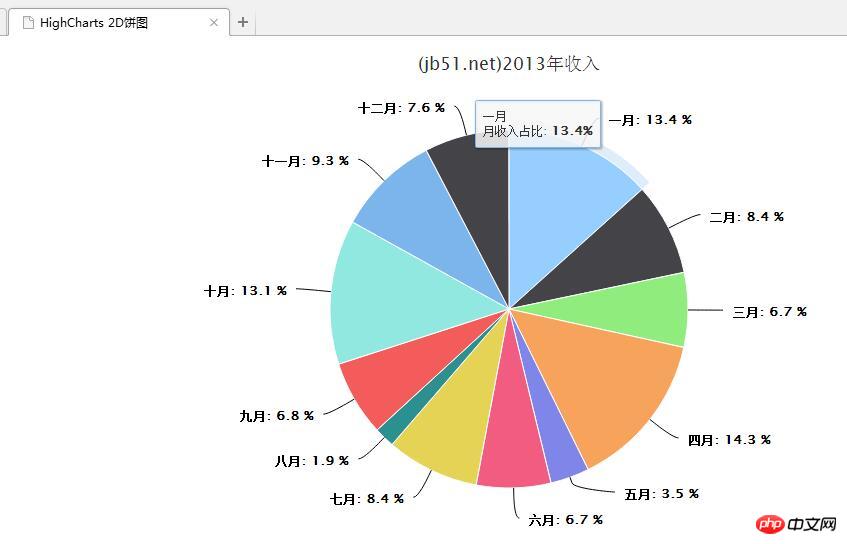
text: '(jb51.net)2013年收入'
},
tooltip: {
pointFormat: '{series.name}: <b>{point.percentage:.1f}%</b>'
},
plotOptions: {
pie: {
allowPointSelect: true,
cursor: 'pointer',
dataLabels: {
enabled: true,
color: '#000000',
connectorColor: '#000000',
format: '<b>{point.name}</b>: {point.percentage:.1f} %'
}
}
},
series: [{
type: 'pie',
name: '月收入占比',
data: [
['一月', 8956],
['二月', 5612],
['三月', 4515],
['四月', 9565],
['五月', 2356],
['六月', 4512],
['七月', 5623],
['八月', 1245],
['九月', 4578],
['十月', 8754],
['十一月',6231],
['十二月',5124]
]
}]
});
});
</script>
</head>
<body>
<p id="pieChart" style="width: 1200px; height: 500px; margin: 0 auto"></p>
</body>
</html>2. The running effect diagram is as follows:
Have you learned it? Hurry up and try it out.
echarts pie chart sector adds click event - Fannn
WeChat applet drawing pie chart implementation
php Generate pie chart three-dimensional pie chart_PHP tutorial
The above is the detailed content of jQuery plug-in HighCharts drawing 2D pie chart effect example sharing. For more information, please follow other related articles on the PHP Chinese website!


![[Web front-end] Node.js quick start](https://img.php.cn/upload/course/000/000/067/662b5d34ba7c0227.png)


