よく使用される echarts チャートの実装コード

不言
リリース: 2018-09-30 15:41:36
転載
5872 人が閲覧しました

この記事では、一般的に使用される echarts チャートの実装コードを紹介します。必要な方は参考にしていただければ幸いです。

この記事のコードは ehcarts4.0
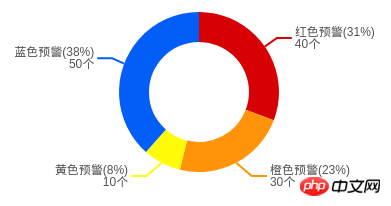
円グラフに基づいて開発されています

よく使用される echarts チャートの実装コード##

// 饼图配置项
    var option = {
        series: [
            {
                name:'风险预警占比',
                type: 'pie',
                radius: ['25%', '40%'],
                center: ['50%', '50%'],
                roseType: false,
                data: [
                    {
                        value: 40,
                        name: '红色预警'
                    }, {
                        value: 30,
                        name: '橙色预警'
                    }, {
                        value: 10,
                        name: '黄色预警'
                    }, {
                        value: 50,
                        name: '蓝色预警'
                    }
                ],
                label: {
                    fontSize: 12,
                    color:'#545454',
                    formatter: function (param) {
                        return param.name + '(' + Math.round(param.percent) + '%' + ')' 
                            + '\n' + param.value +  '个';
                    }
                },
                labelLine: {
                    smooth: false,
                    lineStyle: {
                        width: 2
                    }
                },
                itemStyle: {
                    color:function(params){
                        switch (params.name) {
                            case '红色预警':
                                return '#D70002';
                            case '橙色预警':
                                return '#FF9309';
                            case '黄色预警':
                                return '#FFFB09';
                            case '蓝色预警':
                                return '#035EF7';
                            default:
                                break;
                        }
                    }
                },
            }
        ]
    }
ログイン後にコピー
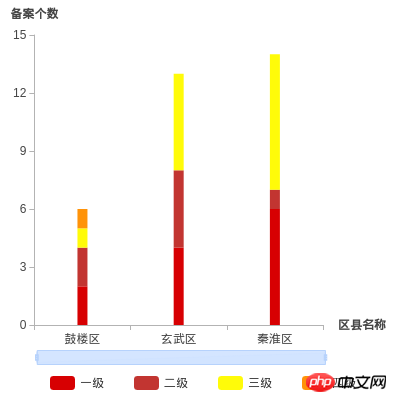
積み上げ縦棒グラフ

よく使用される echarts チャートの実装コード

//堆叠柱状图配置项
  var option = {
      backgroundColor: '#fff',
      tooltip: {
          trigger: 'axis',
          axisPointer: {
              type: 'shadow'
          }
      },
      legend: {
          bottom: '10',
          itemGap: 30,
          data: ['一级', '二级', '三级', '四级']
      },
      grid: { //图表的位置
          top: 30,
          left: 10,
          right: 80,
          bottom: 60,
          containLabel: true
      },
      dataZoom: [
          {
              type: 'inside'
          }, {
              type: 'slider',
              start: 0,
              bottom: 40,
              height: '15px',
              fillerColor:'rgba(202,223,255,.8)',
              borderColor:'#b6d2fc',
              handleStyle:{
                  color:'#b6d2fc'
              },
              dataBackground:{
                  lineStyle:{
                      color:'#b6d2fc'
                  },
                  areaStyle:{
                      color:'rgba(202,223,255,.8)'
                  }
              }
          }
      ],
      yAxis: [
          {
              type: 'value',
              name: '备案个数',
              nameTextStyle: {
                  fontSize: 12,
                  fontWeight: 'bold',
                  color: '#454545'
              },
              splitLine: {
                  show: false
              },
              axisLine: {
                  lineStyle: {
                      color: '#B3B3B3'
                  }
              },
              axisLabel: {
                  color: '#454545'
              }
          }
      ],
      xAxis: [
          {
              type: 'category',
              name: '区县名称',
              nameTextStyle: {
                  fontSize: 12,
                  fontWeight: 'bold',
                  color: '#454545'
              },
              axisLine: {
                  lineStyle: {
                      color: '#B3B3B3'
                  }
              },
              axisLabel: {
                  color: '#454545'
              },
              data: ['鼓楼区','玄武区','秦淮区']
          }
      ],
      series: [
          {
              name: '一级',
              type: 'bar',
              stack: '总量',
              barWidth: '10px',
              itemStyle:{
                  color:'#D70002'
              },
              data: [2,4,6]
          },
          {
              name: '二级',
              type: 'bar',
              stack: '总量',
              barWidth: '10px',
              data: [2,4,1]
          },
          {
              name: '三级',
              type: 'bar',
              stack: '总量',
              barWidth: '10px',
              itemStyle:{
                  color:'#FFFB09'
              },
              data: [1,5,7]
          },
          {
              name: '四级',
              type: 'bar',
              stack: '总量',
              barWidth: '10px',
              itemStyle:{
                  color:'#FF9309'
              },
              data: [1]
          }
      ]
    }
ログイン後にコピー
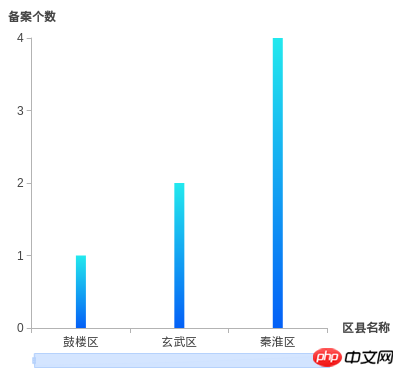
グラデーション縦棒グラフ

よく使用される echarts チャートの実装コード##

//配置项
var option = {
      backgroundColor: '#fff',
      color: [
          new echarts.graphic.LinearGradient(
              0, 0, 0, 1,
              [
                  { offset: 0, color: '#23E9EE' },
                  { offset: 1, color: '#0460F7' }
              ]
          )
      ],
      tooltip: {
          trigger: 'axis',
          axisPointer: {
              type: 'shadow'
          }
      },
      legend: {
          bottom: '10',
          itemGap: 30,
          data: ['一级', '二级', '三级', '四级']
      },
      grid: { //图表的位置
          top: 30,
          left: 10,
          right: 80,
          bottom: 60,
          containLabel: true
      },
      dataZoom: [
          {
              type: 'inside'
          }, {
              type: 'slider',
              start: 0,
              bottom: 40,
              height: '15px',
              fillerColor:'rgba(202,223,255,.8)',
              borderColor:'#b6d2fc',
              handleStyle:{
                  color:'#b6d2fc'
              },
              dataBackground:{
                  lineStyle:{
                      color:'#b6d2fc'
                  },
                  areaStyle:{
                      color:'rgba(202,223,255,.8)'
                  }
              }
          }
      ],
      yAxis: [
          {
              type: 'value',
              name: '备案个数',
              nameTextStyle: {
                  fontSize: 12,
                  fontWeight: 'bold',
                  color: '#454545'
              },
              splitLine: {
                  show: false
              },
              axisLine: {
                  lineStyle: {
                      color: '#B3B3B3'
                  }
              },
              axisLabel: {
                  color: '#454545'
              }
          }
      ],
      xAxis: [
          {
              type: 'category',
              name: '区县名称',
              nameTextStyle: {
                  fontSize: 12,
                  fontWeight: 'bold',
                  color: '#454545'
              },
              axisLine: {
                  lineStyle: {
                      color: '#B3B3B3'
                  }
              },
              axisLabel: {
                  color: '#454545'
              },
              data: ['鼓楼区','玄武区','秦淮区']
          }
      ],
      series: [
          {
              name: '报警',
              type: 'bar',
              stack: '总量',
              barWidth: '10px',
              data: [1,2,4]
          }
      ]
  };
ログイン後にコピー
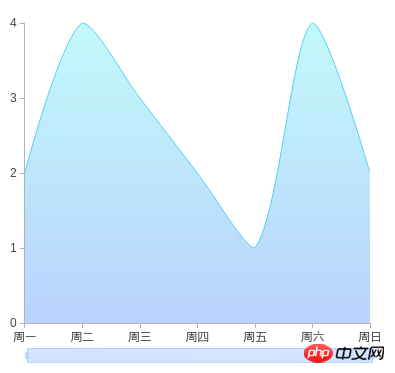
折れ線グラフchart

よく使用される echarts チャートの実装コード

//线图配置项
var option = {
      tooltip: {
          trigger: 'axis'
      },
      color: [
          new echarts.graphic.LinearGradient(
              0, 0, 0, 1,
              [
                  {offset: 0, color: '#23E9EE'},
                  {offset: 1, color: '#0460F7'}
              ]
          )
      ],
      grid: {
          top: 30,
          left: 10,
          right: 30,
          bottom: 50,
          containLabel: true
      },
      dataZoom: [
          {
              type: 'inside'
          }, {
              type: 'slider',
              start: 0,
              bottom: 30,
              height: '15px',
              fillerColor:'rgba(202,223,255,.8)',
              borderColor:'#b6d2fc',
              handleStyle:{
                  color:'#b6d2fc'
              },
              dataBackground:{
                  lineStyle:{
                      color:'#b6d2fc'
                  },
                  areaStyle:{
                      color:'rgba(202,223,255,.8)'
                  }
              }
          }
      ],
      yAxis: [
          {
              type: 'value',
              splitLine: {
                  show: false
              },
              axisLine: {
                  lineStyle: {
                      color: '#B3B3B3'
                  }
              },
              axisLabel: {
                  color: '#454545'
              }
          }
      ],
      xAxis: {
          type: 'category',
          boundaryGap:false,
          axisLine: {
              lineStyle: {
                  color: '#B3B3B3'
              }
          },
          axisLabel: {
              color: '#454545'
          },
          data: ['周一', '周二', '周三', '周四', '周五', '周六', '周日']
      },
      series: [
          {
              name: '报警个数',
              type: 'line',
              symbol: 'emptyCircle',
              symbolSize: 2,
              showSymbol: false,
              smooth: true,
              areaStyle: {
                  color: new echarts.graphic.LinearGradient(
                      0, 0, 0, 1,
                      [
                          {offset: 0, color: 'rgba(35,233,238,.4)'},
                          {offset: 1, color: 'rgba(4,96,247,.4)'}
                      ]
                  )
              },
              lineStyle: {
                  width: 1,
                  color: '#59cef5'
              },
              itemStyle: {
                  borderColor: '#59cef5',
                  borderWidth: 2
              },
              data:[2,4,3,2,1,4,2]
          }
      ]
  }
ログイン後にコピー
インスタンスの作成

var chart = echarts.init(document.getElementById('chartBox'));
ログイン後にコピー

チャートインスタンスの設定項目を設定

設定項目とデータを設定チャート インスタンス、ユニバーサル インターフェイスのすべてのパラメーターとデータの変更は、setOption を通じて完了できます。ECharts は新しいパラメーターとデータをマージし、char
chart.setOption(option);
ログイン後にコピー

を更新します。

以上がよく使用される echarts チャートの実装コードの詳細内容です。詳細については、PHP 中国語 Web サイトの他の関連記事を参照してください。

関連ラベル:
ソース:segmentfault.com
このウェブサイトの声明
この記事の内容はネチズンが自主的に寄稿したものであり、著作権は原著者に帰属します。このサイトは、それに相当する法的責任を負いません。盗作または侵害の疑いのあるコンテンツを見つけた場合は、admin@php.cn までご連絡ください。
最新の問題
人気のチュートリアル
詳細>
最新のダウンロード
詳細>
ウェブエフェクト
公式サイト
サイト素材
フロントエンドテンプレート
私たちについて 免責事項 Sitemap
PHP中国語ウェブサイト:福祉オンライン PHP トレーニング,PHP 学習者の迅速な成長を支援します!