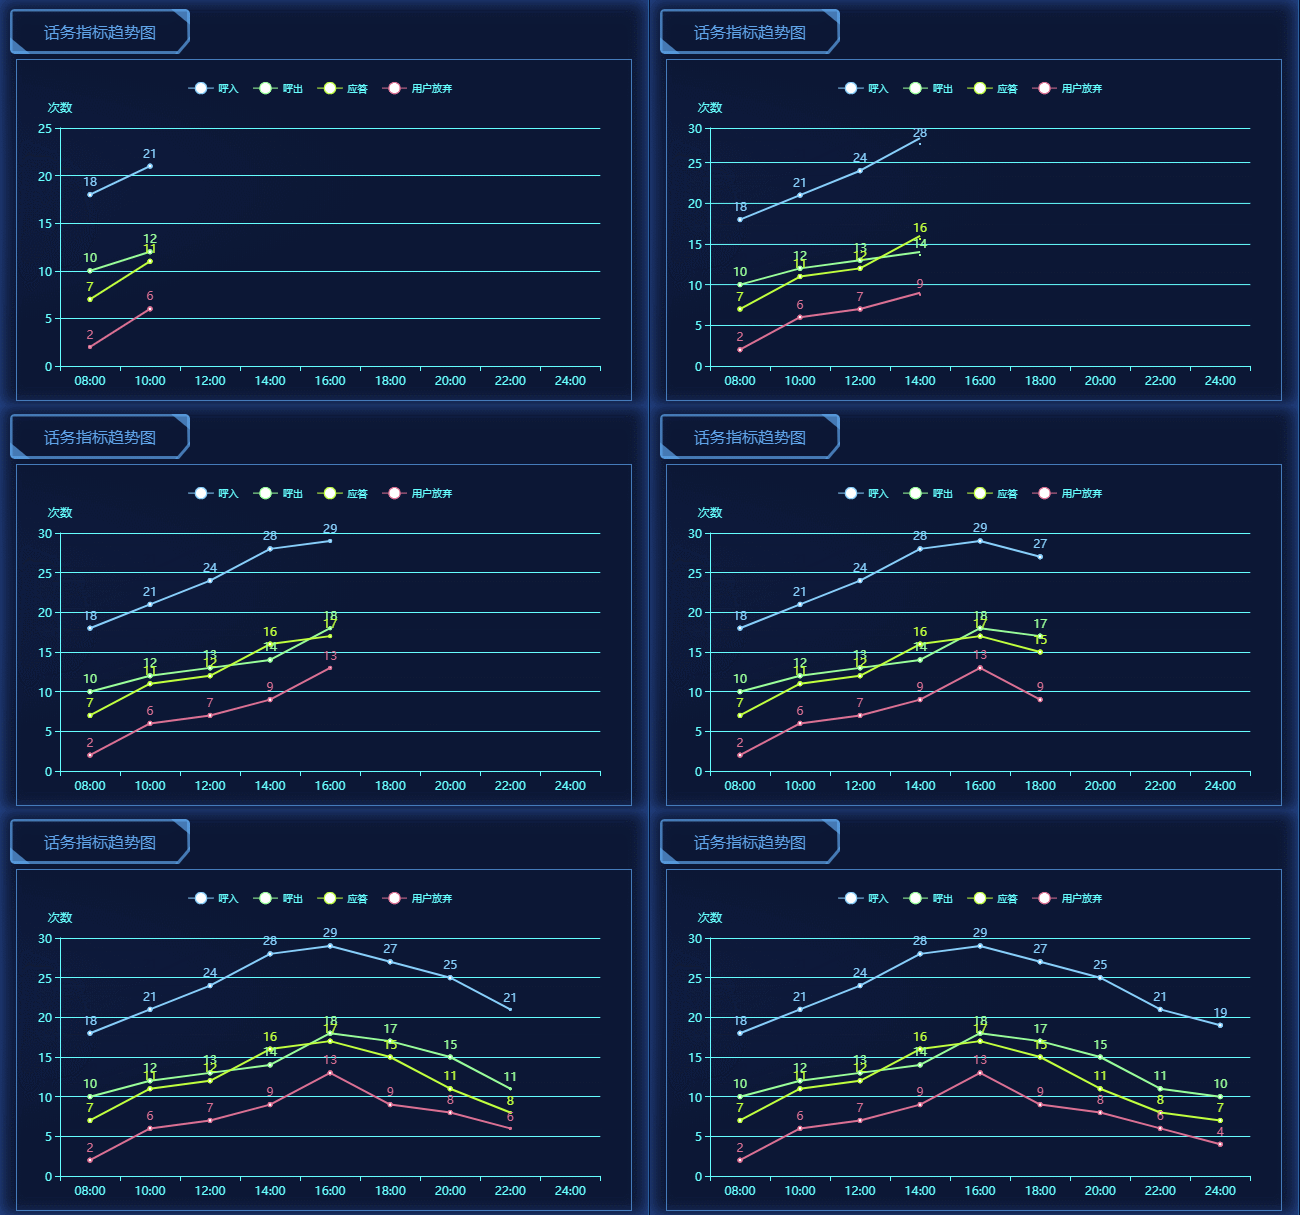
hotlineLine();
setInterval(function () {
hotlineLine();
},5000);
function hotlineLine(){
var hotlineLine = echarts.init(document.getElementById('hotlineLine_id'));
$.get('${pageContext.request.getContextPath()}/m/hotline.do', function (res) {
var option = {
tooltip: {
trigger: 'axis'
},
color: ['#87CEFA', '#9AFF9A', '#C0FF3E','#DB7093'],
legend: {
data:['呼入', '呼出', '应答', '用户放弃'],
textStyle:{
fontSize:10,
color:'#66ffff'
},
top:'5%'
},
grid: {
left: '7%',
right: '5%',
bottom: '10%',
top:'20%'
},
xAxis: {
type: 'category',
data: ['08:00', '10:00', '12:00', '14:00', '16:00', '18:00', '20:00', '22:00', '24:00'],
axisLine:{
lineStyle:{
color:'#66ffff'
}
}
},
yAxis: {
type: 'value',
name: '次数',
axisLabel: {
formatter: '{value}'
},
axisLine:{
lineStyle:{
color:'#66ffff'
}
},
splitLine:{
show: true,
lineStyle:{
color:'#66ffff'
}
}
},
series: [
{
name:'呼入',
type:'line',
data:res[3]
},
{
name:'呼出',
type:'line',
data:res[2]
},
{
name:'应答',
type:'line',
data:res[1]
},
{
name:'用户放弃',
type:'line',
data:res[0]
}
],
label: {
show: true,
position: 'top',
textStyle: {
fontWeight:'bolder',
fontSize : '12',
fontFamily : '微软雅黑',
color:defaultColor
}
}
};
hotlineLine.setOption(option);
});
}
<p class="rightMain01-sub03 box-border">
<p class="box-title">话务指标趋势图</p>
<p class="rightMain01-sub03-data">
<p id="hotlineLine_id" style="height:340px;"></p>
</p>
</p>

