
WeChatアプレットチャートツール、WeChat小型アプリ用チャート
キャンバス描画に基づく、小さいサイズ
チャートタイプをサポート
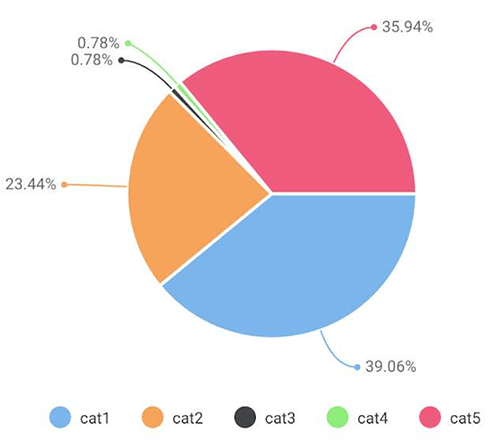
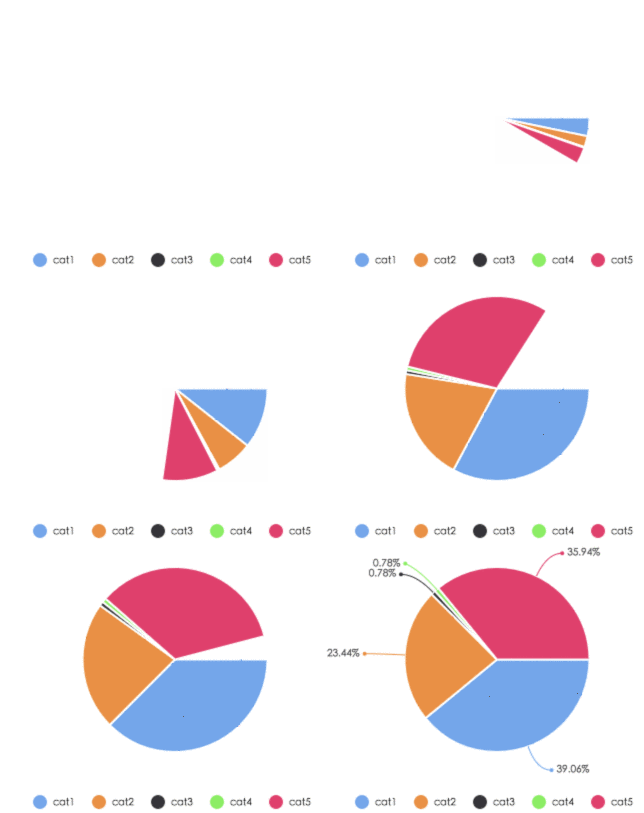
円グラフパイ
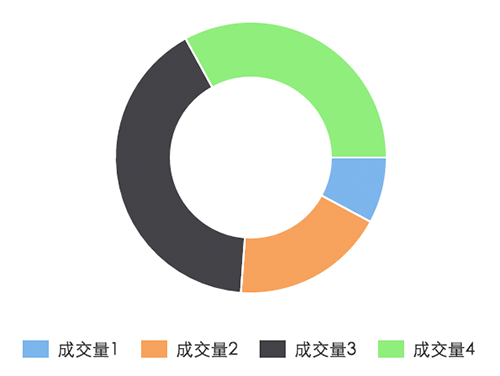
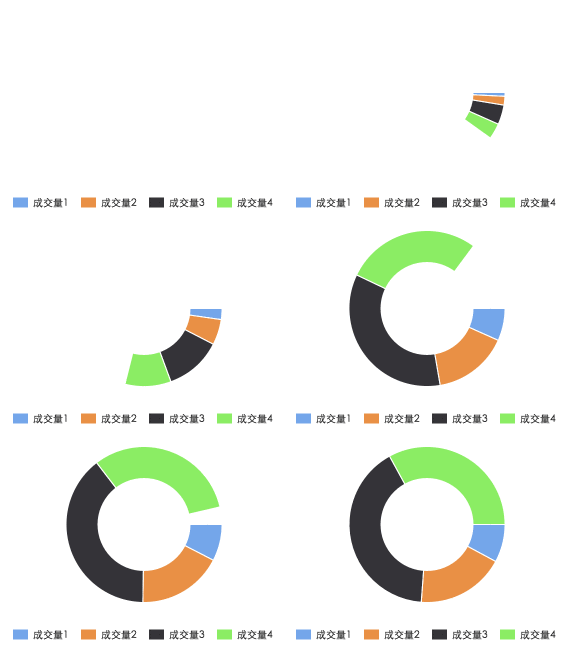
ドーナツリング
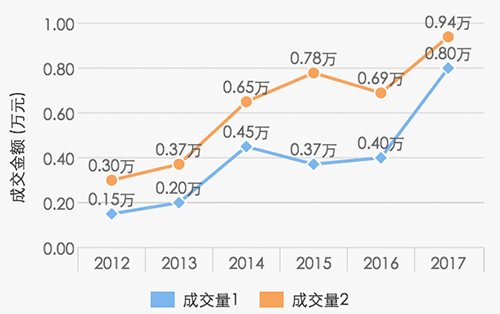
折れ線グラフ
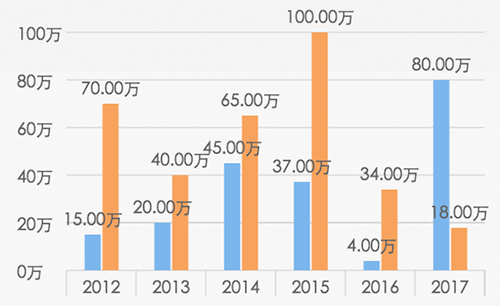
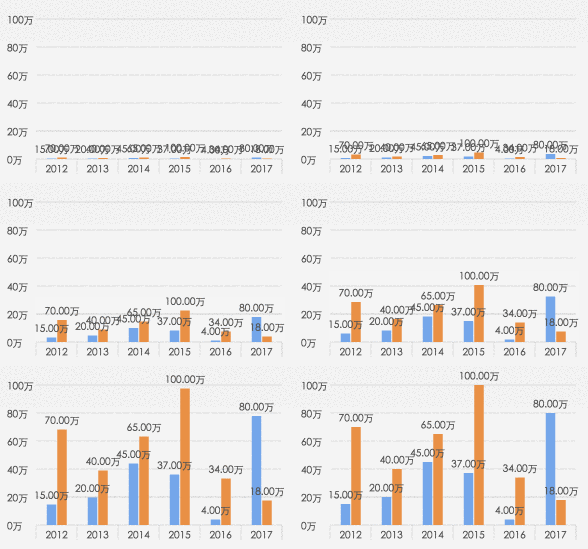
棒グラフ列
面グラフ領域
コード分析はこちら
パラメータの説明
opts Object
opts.canvasId 文字列必須 WeChat アプレット Canvas -id
opts.width 数値必要なキャンバス幅、単位は px
opts.height 数値 必要なキャンバスの高さ、単位は px
opts.title オブジェクト (リング チャートのみ)
opts.title.name String タイトル content
opts.title.fontSize Number タイトルのフォント サイズ (オプション、単位はpx)
opts.title.color String タイトルの色(オプション)
opts.subtitle オブジェクト(リングチャートのみ)
opts.subtitle.name String 字幕コンテンツ
opts.subtitle.fontSize Number 字幕フォントサイズ (オプション、単位は px)
opts.subtitle.color String 字幕の色 (オプション)
opts.animation Boolean デフォルト true 表示をアニメーション化するかどうか
opts.legend Boolen デフォルト true 各カテゴリの識別を表示するかどうかグラフの下
opts.type 文字列必須 グラフの種類、オプションの値は円、折れ線、縦棒、面、リングです
opts.categories 配列必須(円グラフとドーナツグラフには不要) データカテゴリ カテゴリ
opts.dataLabel Boolean デフォルト true チャートにデータ内容値を表示するかどうか
opts.dataPointShape Boolean デフォルト true チャートにデータ ポイントのグラフィック識別子を表示するかどうか
opts.xAxis オブジェクトの X 軸構成
opts。 xAxis.disableGrid Boolean デフォルト false X 軸のグリッドを描画しません
opts.yAxis オブジェクト Y 軸の設定
opts.yAxis.format 機能 Y 軸のコピー表示をカスタマイズします
opts.yAxis.min 数値 Y 軸開始値
opts.yAxis .max 数値 Y 軸の終端値
opts.yAxis.title 文字列 Y 軸のタイトル
opts.yAxis.disabled Boolean デフォルト false Y 軸を描画しません
opts.series 配列が必要ですデータリスト
データリスト 各構造定義
dataItem オブジェクト
dataItem.data 配列必須(円グラフ、ドーナツグラフの場合は数値) data
dataItem.color 文字列 例: #7cb5ec 渡されない場合、システムデフォルトの配色が使用されます
dataItem.name String データ名
dateItem.format Function 表示データの内容をカスタマイズします
例
var wxCharts = require('wxcharts.js');
new wxCharts({
 canvasId: 'pieCanvas',
 type: 'pie',
 series: [{
  name: 'cat1',
  data: 50,
 }, {
  name: 'cat2',
  data: 30,
 }, {
  name: 'cat3',
  data: 1,
 }, {
  name: 'cat4',
  data: 1,
 }, {
  name: 'cat5',
  data: 46,
 }],
 width: 360,
 height: 300,
 dataLabel: true
});
new wxCharts({
 canvasId: 'ringCanvas',
 type: 'ring',
 series: [{
  name: '成交量1',
  data: 15,
 }, {
  name: '成交量2',
  data: 35,
 }, {
  name: '成交量3',
  data: 78,
 }, {
  name: '成交量4',
  data: 63,
 }],
 width: 320,
 height: 200,
 dataLabel: false
});
new wxCharts({
 canvasId: 'lineCanvas',
 type: 'line',
 categories: ['2012', '2013', '2014', '2015', '2016', '2017'],
 series: [{
  name: '成交量1',
  data: [0.15, 0.2, 0.45, 0.37, 0.4, 0.8],
  format: function (val) {
   return val.toFixed(2) + '万';
  }
 }, {
  name: '成交量2',
  data: [0.30, 0.37, 0.65, 0.78, 0.69, 0.94],
  format: function (val) {
   return val.toFixed(2) + '万';
  }
 }],
 yAxis: {
  title: '成交金额 (万元)',
  format: function (val) {
   return val.toFixed(2);
  },
  min: 0
 },
 width: 320,
 height: 200
}); 

new wxCharts({
 canvasId: 'columnCanvas',
 type: 'column',
 categories: ['2012', '2013', '2014', '2015', '2016', '2017'],
 series: [{
  name: '成交量1',
  data: [15, 20, 45, 37, 4, 80]
 }, {
  name: '成交量2',
  data: [70, 40, 65, 100, 34, 18]
 }],
 yAxis: {
  format: function (val) {
   return val + '万';
  }
 },
 width: 320,
 height: 200
});
new wxCharts({
 canvasId: 'areaCanvas',
 type: 'area',
 categories: ['2016-08', '2016-09', '2016-10', '2016-11', '2016-12', '2017'],
 series: [{
  name: '成交量1',
  data: [70, 40, 65, 100, 34, 18],
  format: function (val) {
   return val.toFixed(2) + '万';
  }
 }, {
  name: '成交量2',
  data: [15, 20, 45, 37, 4, 80],
  format: function (val) {
   return val.toFixed(2) + '万';
  }
 }],
 yAxis: {
  format: function (val) {
   return val + '万';
  }
 },
 width: 320,
 height: 200
});
デモのダウンロードアドレス:demo
以上がこの記事の全内容です。皆様の学習に役立つことを願っております。また、皆様にも PHP 中国語 Web サイトをサポートしていただければ幸いです。
WeChat アプレット チャート プラグイン (wx-charts) サンプル コードに関連するその他の記事については、PHP 中国語 Web サイトに注目してください。