


Many people don’t know how to make an Excel line chart. This article is compiled and organized by php editor Yuzai, aiming to help you quickly master this skill. If you need to make a line chart to visualize data, track trends, or make comparisons, continue reading below for a detailed tutorial.
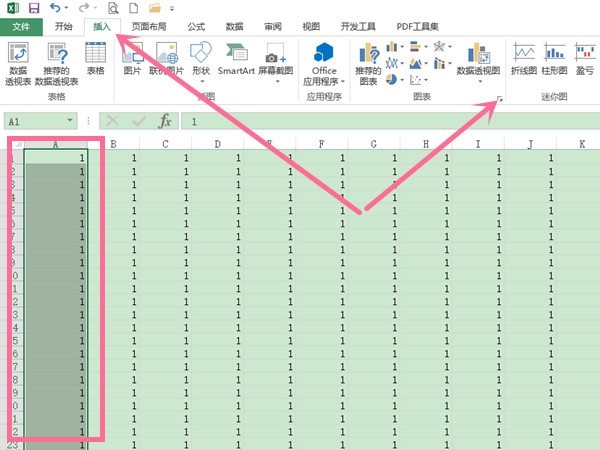
1. Open the excel table, select the data, click Insert, and then click the expand icon on the right side of the chart option.
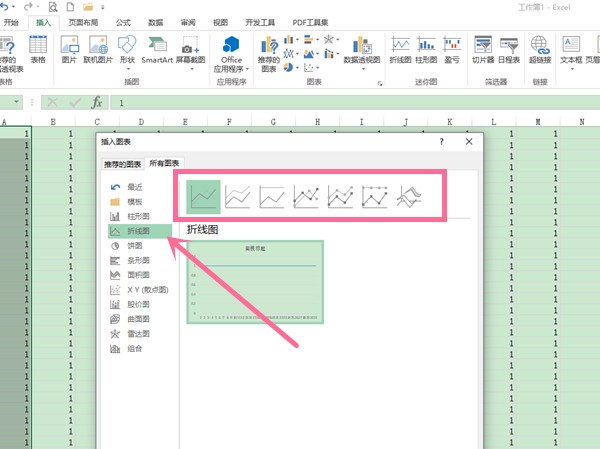
2. Click the line chart on the All Charts page, select the type of line chart you want to create, and click OK.
The above is the detailed content of How to create a line chart in excel_Excel line chart creation tutorial. For more information, please follow other related articles on the PHP Chinese website!


![[Web front-end] Node.js quick start](https://img.php.cn/upload/course/000/000/067/662b5d34ba7c0227.png)


