


zabbix本身提供了很多可选的监控项,可以满足绝大部分的监控需求。有时候由于业务需求,需要自定义监控项。 下面以创建mysql自定义监控项为例,分享如何创建zabbix自定义监控项。
zabbix版本:3.0.3 操作系统:CentOS 7 mysql版本:5.7.1
1、修改 zabbix_agentd.conf,添加zabbix_agent 配置目录,以下是我本机的zabbix的配置: 将以下行的注释去掉
   #<span class="hljs-keyword">Include</span>=<span class="hljs-regexp">/usr/</span>local<span class="hljs-regexp">/etc/</span>zabbix_agentd.conf.d<span class="hljs-comment">/*.conf
</span>
变成:
   <span class="hljs-keyword">Include</span>=<span class="hljs-regexp">/usr/</span>local<span class="hljs-regexp">/etc/</span>zabbix_agentd.conf.d<span class="hljs-comment">/*.conf
</span>
将此行注释去掉后,zabbix_agentd启动后会自动扫描/usr/local/etc/zabbix_agentd.conf.d/目录下所有的.conf文件,并加载。
2、编写监控脚本/usr/local/zabbix/zabbix-script/get_mysql_status.sh,脚本如下(脚本存放目录可以自定义):
<span class="hljs-meta">#!/bin/sh
</span>
<span class="hljs-keyword">case</span> <span class="hljs-variable">$3</span> <span class="hljs-keyword">in</span>
uptime)
mysqladmin -u<span class="hljs-variable">$1</span> -p<span class="hljs-variable">$2</span> status 2>/dev/nul | awk -F <span class="hljs-string">'[:| ]'</span>+ <span class="hljs-string">'{print $2}'</span>
;;
threads)
mysqladmin -u<span class="hljs-variable">$1</span> -p<span class="hljs-variable">$2</span> status 2>/dev/nul | awk -F <span class="hljs-string">'[:| ]'</span>+ <span class="hljs-string">'{print $4}'</span>
;;
question)
mysqladmin -u<span class="hljs-variable">$1</span> -p<span class="hljs-variable">$2</span> status 2>/dev/nul | awk -F <span class="hljs-string">'[:| ]'</span>+ <span class="hljs-string">'{print $6}'</span>
;;
sq)
mysqladmin -u<span class="hljs-variable">$1</span> -p<span class="hljs-variable">$2</span> status 2>/dev/nul | awk -F <span class="hljs-string">'[:| ]'</span>+ <span class="hljs-string">'{print $9}'</span>
;;
open)
mysqladmin -u<span class="hljs-variable">$1</span> -p<span class="hljs-variable">$2</span> status 2>/dev/nul | awk -F <span class="hljs-string">'[:| ]'</span>+ <span class="hljs-string">'{print $11}'</span>
;;
ftable)
mysqladmin -u<span class="hljs-variable">$1</span> -p<span class="hljs-variable">$2</span> status 2>/dev/nul | awk -F <span class="hljs-string">'[:| ]'</span>+ <span class="hljs-string">'{print $14}'</span>
;;
opent)
mysqladmin -u<span class="hljs-variable">$1</span> -p<span class="hljs-variable">$2</span> status 2>/dev/nul | awk -F <span class="hljs-string">'[:| ]'</span>+ <span class="hljs-string">'{print $17}'</span>
;;
qps)
mysqladmin -u<span class="hljs-variable">$1</span> -p<span class="hljs-variable">$2</span> status 2>/dev/nul | awk -F <span class="hljs-string">'[:| ]'</span>+ <span class="hljs-string">'{print $22}'</span>
;;
*)
脚本说明,脚本需要输入三个参数分别是:mysql用户、mysql用户密码、mysql状态各项指标如下: uptime:运行时长单位s、 threads:开启的会话数、 question(questions):服务器启动以来客户的问题(查询)数目 sq(Slow queries): 慢查询数量 open(opens):服务器已经打开的数据库表的数量 ftable(Flush tables):服务器已经执行的flush ...、refresh和reload命令的数量 opent(open tables):通过命令是用的数据库的表的数量,以服务器启动开始 qps(Queries per second avg):select语句平均查询时间
3、在/usr/local/etc/zabbix_agentd.conf.d/目录下添加监控项配置文件get_mysql_status.conf,内容如下:
UserParameter=get_mysql_status[*],<span class="hljs-regexp">/usr/local</span><span class="hljs-regexp">/zabbix/zabbix</span>-script/get_mysql_status.sh <span class="hljs-variable">$1</span> <span class="hljs-variable">$2</span> <span class="hljs-variable">$3</span>
4、重启zabbix_agent和zabbix_server,使用zabbix_get测试,如下:
   <span class="hljs-selector-id">#zabbix_get</span> <span class="hljs-selector-tag">-s</span> 127<span class="hljs-selector-class">.0</span><span class="hljs-selector-class">.0</span><span class="hljs-selector-class">.1</span> <span class="hljs-selector-tag">-k</span> <span class="hljs-selector-tag">get_mysql_status</span><span class="hljs-selector-attr">[root,weiming,open]</span>
   679
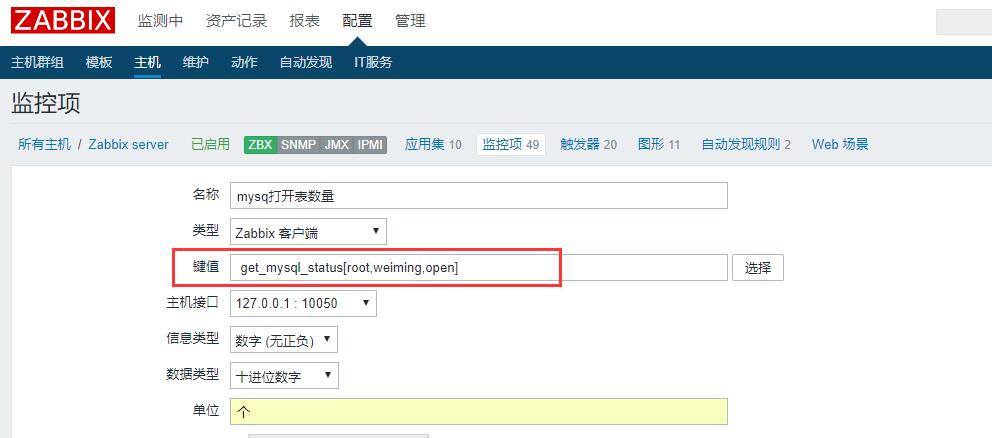
5、web端添加监控项: 在主机上添加监控项:
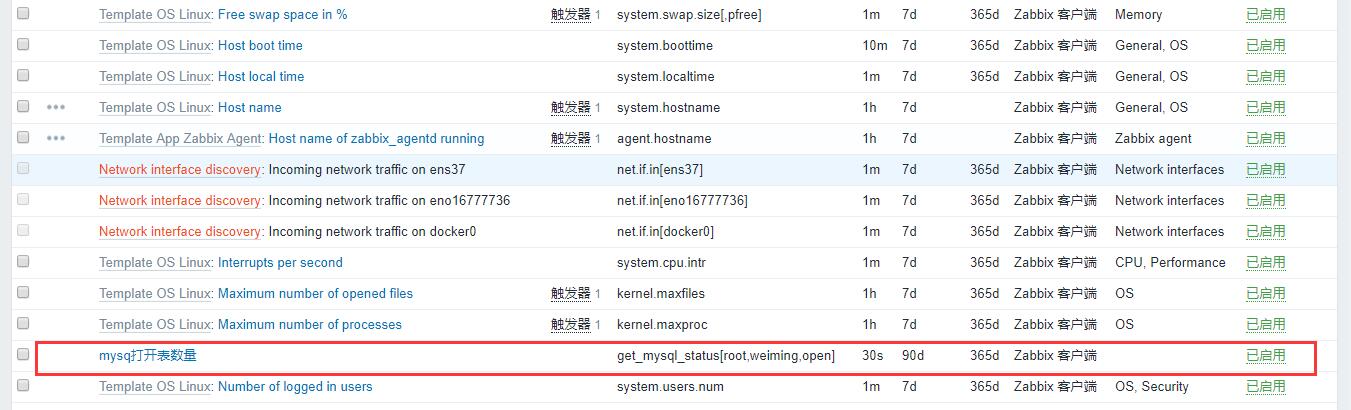
添加完成后可以看到新增监控项如下:
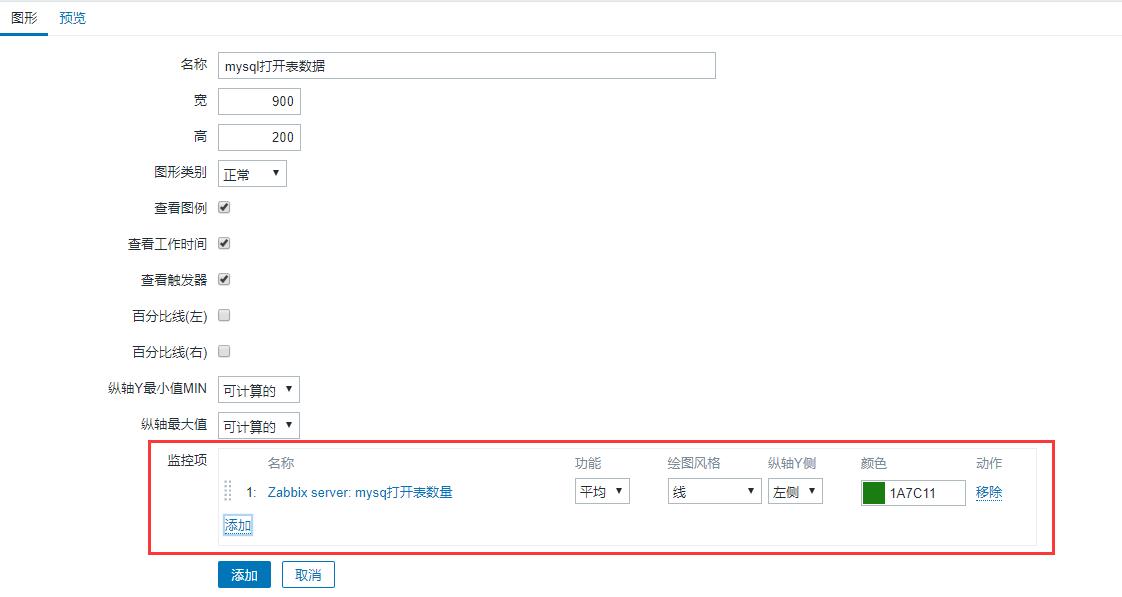
添加图形:
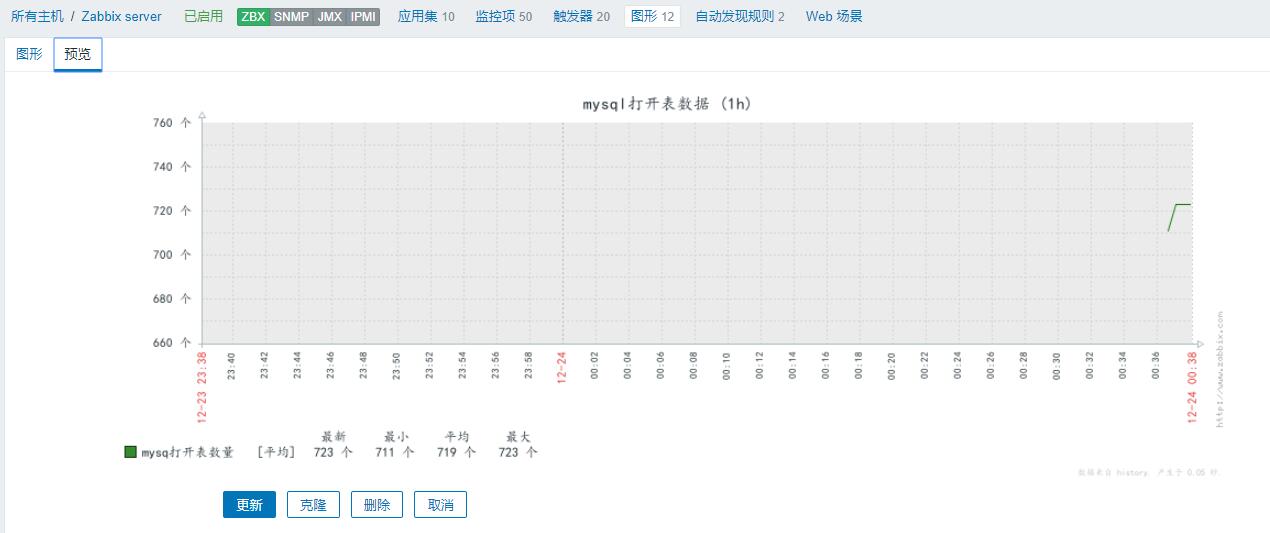
图形预览:
The above is the detailed content of How to create custom monitoring items with zabbix. For more information, please follow other related articles on the PHP Chinese website!


![[Web front-end] Node.js quick start](https://img.php.cn/upload/course/000/000/067/662b5d34ba7c0227.png)


