In the field of computer science, a graph structure consists of nodes (representing entities) and edges (representing relationships between entities).
Pictures are everywhere.
The Internet can be regarded as a huge network, and search engines use graphical methods to organize and display information.
LLMs are mainly trained on regular text, so converting graphs into text understandable by LLMs is a challenging task because graph structures are fundamentally different from text.
At ICLR 2024, a team from Google explored how to transform graph data into a form suitable for LLMs to understand.

Paper address: https://openreview.net/pdf?id=IuXR1CCrSi

The process of encoding graphs into text using two different methods and feeding text and questions back to LLM
They also developed a tool called GraphQA A benchmark that explores approaches to solving different graph reasoning problems and shows how to formulate these problems in a way that is conducive to LLM solving graph-related problems.
Using the correct method, LLMs can improve the performance of graphics tasks by up to 60%.
First, the Google team designed the GraphQA benchmark, which can be viewed as An exam designed to assess LLM's ability to address specific graphics problems.
GraphOA ensures diversity in breadth and number of connections by using multiple types of graphs to find possible biases in LLMs when processing graphs and make the entire process closer to LLMs situations that may be encountered in practical applications.

A framework for inference on LLMs using GraphIQA
Although the task is simple, such as checking whether an edge existence, counting the number of nodes or edges, etc., but these tasks require LLMs to understand the relationship between nodes and edges, which is crucial for more complex graph reasoning.
At the same time, the team also explored how to convert graphs into text that LLMs can process, such as solving the following two key issues:
Node encoding: How do we represent a single node? Nodes can include simple integers, common names (people, characters), and letters.
Edge Coding: How do we describe the relationships between nodes? Methods can include parentheses, phrases (such as "are friends"), and symbolic representations (such as arrows).
In the end, the researchers systematically combined various node and edge encoding methods to produce functions like those shown in the figure below.

Example of graphical encoding function
The research team conducted three key experiments on GraphOA:
In Chapter In one experiment, LLMs performed mediocrely. On most basic tasks, LLMs performed no better than random guessing.
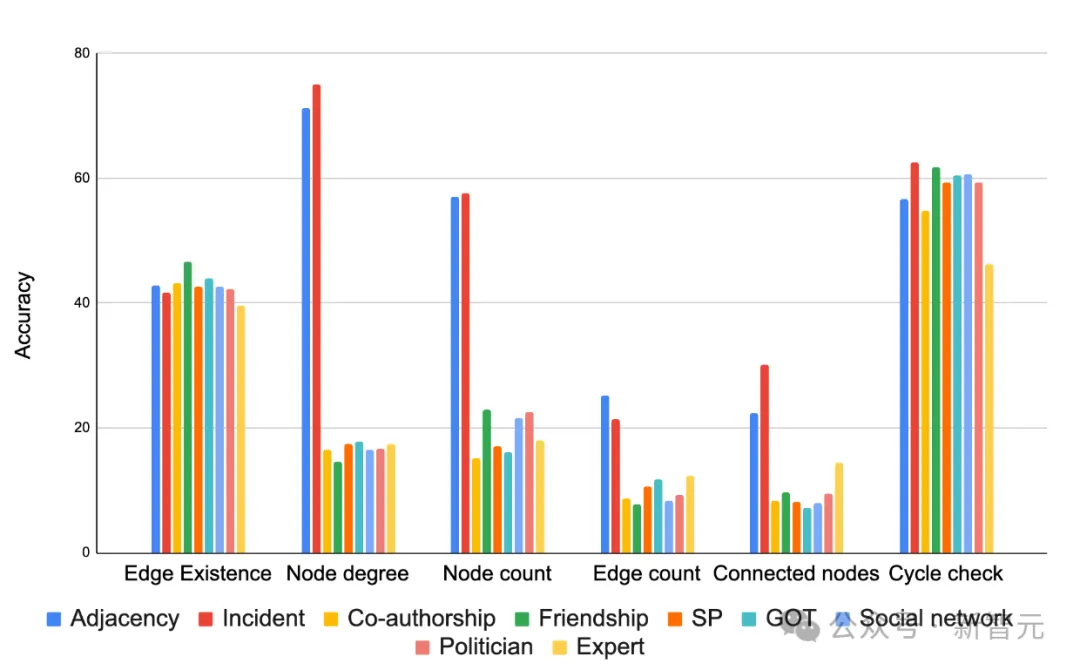
But the encoding method significantly affects the results. As shown in the figure below, in most cases, "incident" encoding performs well in most tasks. Choosing the appropriate encoding function can greatly improve the accuracy of the task.

Comparison of various graph encoder functions based on different task accuracy
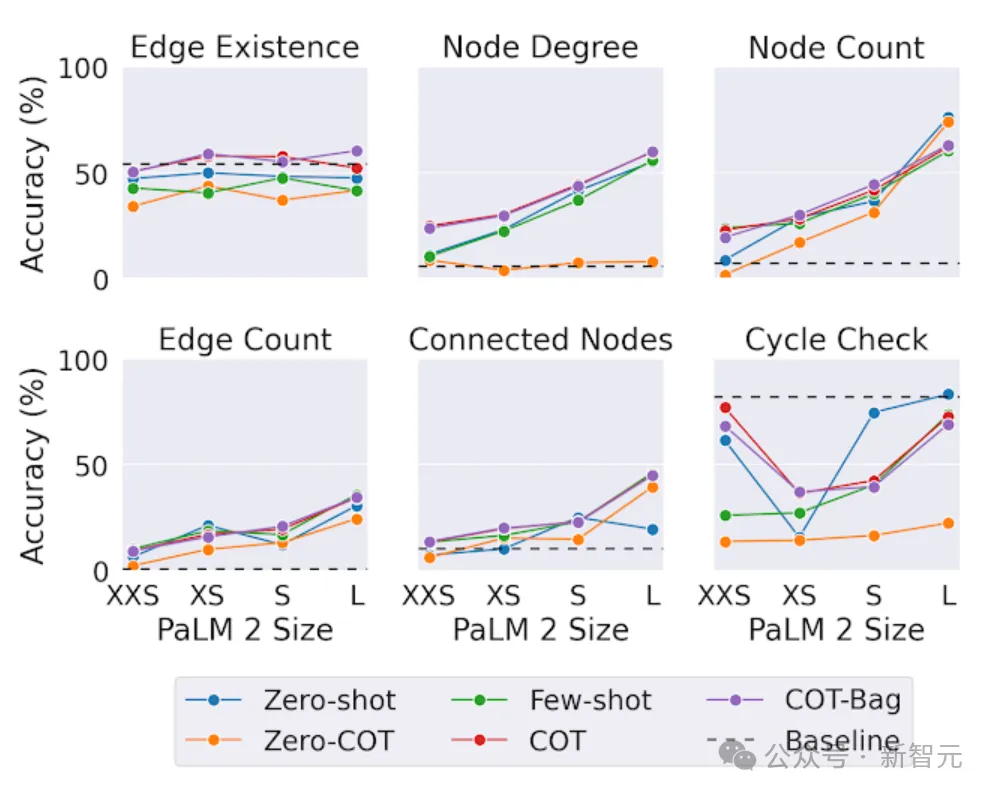
In the second test, the researchers tested the same on different sized models graphics tasks.
In terms of conclusion, in graphical inference tasks, larger models perform better,
However, interestingly, in In the "edge existence" task (determining whether two nodes in the graph are connected), scale is not as important as in other tasks.
Even the largest LLM cannot always beat simple baseline solutions on the cycle checking problem (determining whether a cycle exists in the graph). This shows that LLMs still have room for improvement on certain graph tasks.

The impact of model capacity on graph reasoning tasks of PaLM 2-XXS, XS, S and L
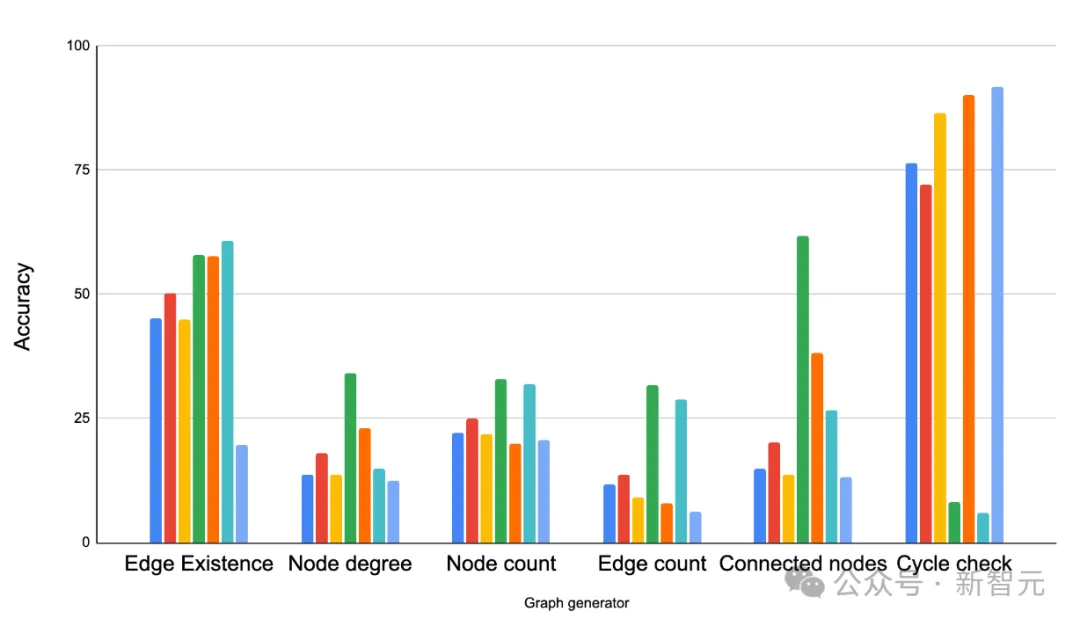
In the third test, the researchers used GraphOA to generate graphs with different structures for analysis as to whether the graph structure would affect the ability of LMMs to solve problems.

# Examples of graphs generated by GraphQA’s different graph generators. ER, BA, SBM and SFN are Erdős-Rényi, Barabási-Albert, stochastic block model and scale-free network respectively.
The results show that the structure of the graph has a great impact on the performance of LLMs.
For example, in a task asking whether cycles exist, LLMs perform well in closely connected graphs (where cycles are common) but not in path graphs (where cycles are common). never happens).
But at the same time, providing some mixed samples helps LLMs adapt. For example, in the cycle detection task, the researchers added some examples that contain cycles and some that do not contain cycles in the prompts as less Examples of sample learning improve the performance of LLMs in this way.

Compare different graph generators on different graph tasks. The main observation is that graph structure has a significant impact on the performance of LLM. ER, BA, SBM and SFN refer to Erdős-Rényi, Barabási-Albert, stochastic block model and scale-free network respectively.
In the paper, the Google team initially explored how to best represent graphs as text so that LLMs can understand them.
With the help of correct coding techniques, the accuracy of LLMs on graph problems is significantly improved (from about 5% to over 60% improvement).
At the same time, three main influencing factors were also determined, which are the encoding method of converting graphics into text, the task types of different graphics, and the density structure of graphics.
This is just the beginning for LLMs to understand graphs. With the help of the new benchmark GraphQA, we look forward to further research to explore more possibilities of LLMs.
The above is the detailed content of LLM performance is improved by up to 60%! Google ICLR 2024 masterpiece: Let the large language model learn the 'language of graphs'. For more information, please follow other related articles on the PHP Chinese website!


