


Due to my interest in the Linux operating system and my desire for underlying knowledge, I compiled this article. It serves as a check for basic knowledge and covers all aspects of the system. The tools in the documentation cannot be fully mastered without complete knowledge of computer systems, networks, and operating systems. In addition, system performance analysis and optimization is a long-term series.
This document is mainly a comprehensive article compiled from the updated Linux performance tuning tool blog post by Brendan Gregg, a Linux guru and Netflix senior performance architect, and collected articles related to Linux system performance optimization. It mainly explains the principles and performance testing tools involved in conjunction with the blog post.
Background knowledge: When analyzing performance problems, understanding background knowledge is necessary. For example, hardware cache; another example is the operating system kernel. The details of the application's behavior are often intertwined with these things, and these low-level things can affect the performance of the application in unexpected ways. For example, some programs fail to fully utilize the cache, resulting in poor performance. For example, too many system calls are called unnecessarily, causing frequent kernel/user switching, etc.
First look at a picture:
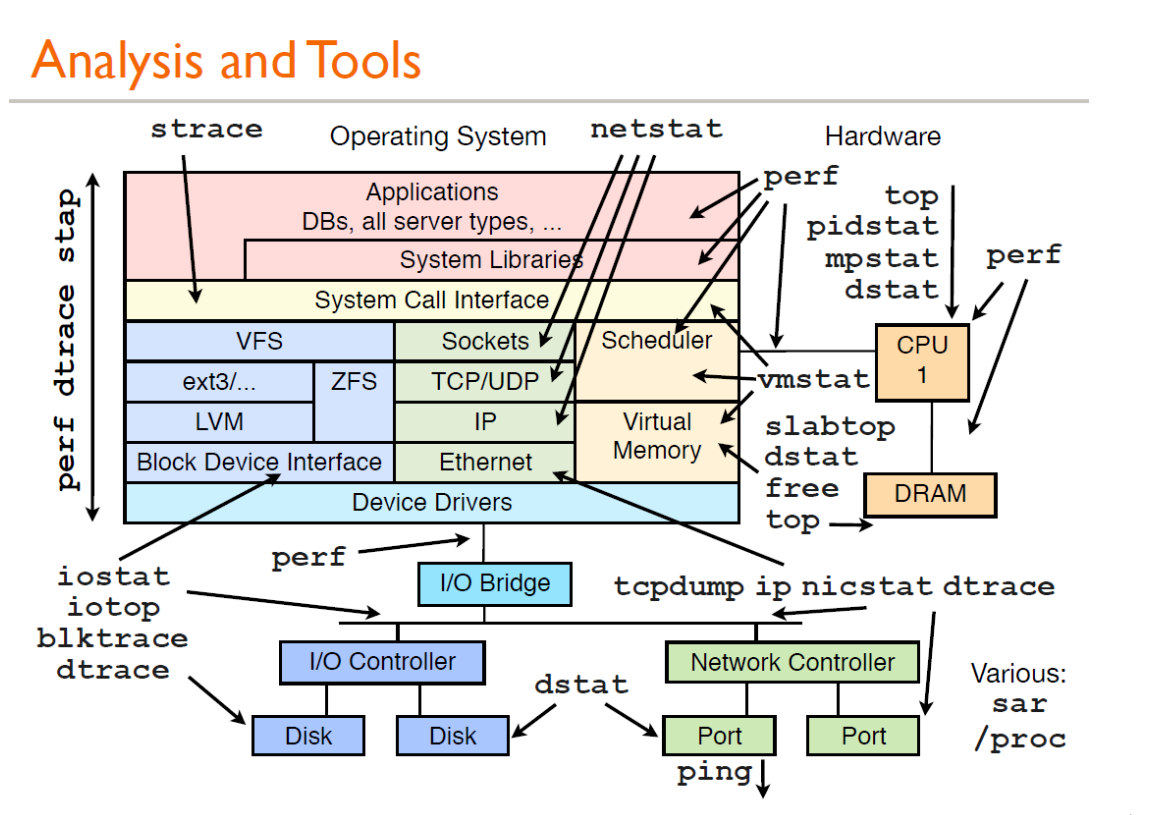
The picture above is a performance analysis shared by Brendan Gregg. All tools here can get their help documents through man. Here is a brief introduction to the general usage:
vmstat (VirtualMeomoryStatistics, virtual memory statistics) is a common tool for monitoring memory in Linux. It can monitor the overall situation of the operating system's virtual memory, processes, CPU, etc. General usage of vmstat: vmstat interval times means sampling once every interval seconds, for a total of times times. If times is omitted, then Data is collected until manually stopped by the user. Just give a simple example:
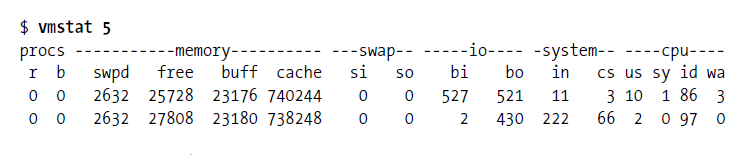
You can use ctrl c to stop vmstat collecting data.
The first row shows the average value of the system since it was started. The second row starts to show what is happening now. The following rows will show what is happening every 5 seconds. The meaning of each column is in the header, as follows Shown:
Symptoms of insufficient memory: free memory decreases sharply, recycling buffers and caches does not help, extensive use of swap partitions (swpd), frequent page exchanges (swap), increased number of read and write disks (io), and page fault interruptions (in) increases, the number of context switches (cs) increases, the number of processes waiting for IO (b) increases, and a lot of CPU time is used to wait for IO (wa)
iostat is used to report central processing unit (CPU) statistics and input/output statistics for the entire system, adapters, tty devices, disks, and CD-ROMs. By default, the same cpu usage information as vmstat is displayed. Use the following command Show extended device statistics:
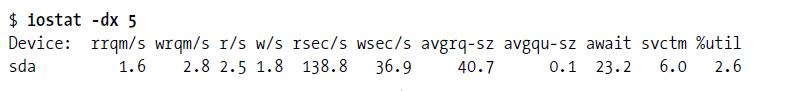
The first line shows the average since system startup, then the incremental averages are shown, one line per device.
Common Linux disk IO indicator abbreviation habits: rq is request, r is read, w is write, qu is queue, sz is size, a is verage, tm is time, and svc is service.
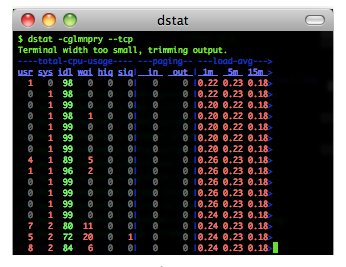
dstat displays the cpu usage, disk io status, network packet sending status and paging status. The output is colorful and highly readable. Compared with the input of vmstat and iostat, it is more detailed and intuitive. When using it, just enter the command directly, and of course you can also use specific parameters.
is as follows: dstat –cdlmnpsy
The iotop command is a command specifically designed to display hard disk IO. The interface style is similar to the top command and can display which process specifically generates the IO load. It is a top tool used to monitor disk I/O usage. It has a UI similar to top, including PID, user, I/O, process and other related information.
Can be used in a non-interactive manner:
iotop –bod interval
To view the I/O of each process, you can use
pidstat,pidstat –d instat
pidstat is mainly used to monitor the usage of system resources by all or specified processes, such as CPU, memory, device IO, task switching, threads, etc.
使用方法:
pidstat –d interval
pidstat 还可以用以统计CPU使用信息:
pidstat –u interval
统计内存信息:
pidstat –r interval
任务区域默认显示:进程 ID,有效用户,进程优先级,NICE 值,进程使用的虚拟内存,物理内存和共享内存,进程状态,CPU 占用率,内存占用率,累计 CPU 时间,进程命令行信息。
htop 是 Linux 系统中的一个互动的进程查看器,一个文本模式的应用程序(在控制台或者X终端中),需要 ncurses。
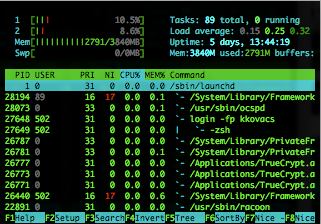
Htop 可让用户交互式操作,支持颜色主题,可横向或纵向滚动浏览进程列表,并支持鼠标操作。
与 top 相比,htop 有以下优点:
mpstat 是 Multiprocessor Statistics的缩写,是实时系统监控工具。其报告CPU的一些统计信息,这些信息存放在 /proc/stat 文件中。在多 CPUs 系统里,其不但能查看所有 CPU 的平均状况信息,而且能够查看特定 CPU 的信息。常见用法:
mpstat –P ALL interval times
netstat 用于显示与 IP、TCP、UDP和 ICMP 协议相关的统计数据,一般用于检验本机各端口的网络连接情况。
常见用法:
netstat –npl   # 可以查看你要打开的端口是否已经打开。

netstat –rn    # 打印路由表信息。

netstat –in    # 提供系统上的接口信息,打印每个接口的MTU,输入分组数,输入错误,输出分组数,输出错误,冲突以及当前的输出队列的长度。
ps 参数太多,具体使用方法可以参考 man ps
常用的方法:
ps  aux       #hsserver

ps –ef |grep   #hundsun
杀掉某一程序的方法:
ps aux | grep mysqld | grep –v grep | awk ‘{print $2 }’ xargs kill -9
杀掉僵尸进程:
ps –eal | awk ‘{if ($2 == “Z”){print $4}}’ | xargs kill -9
跟踪程序执行过程中产生的系统调用及接收到的信号,帮助分析程序或命令执行中遇到的异常情况。
举例:查看 mysqld 在 linux 上加载哪种配置文件,可以通过运行下面的命令:
strace –e stat64 mysqld –print –defaults > /dev/null
能够打印系统总共运行了多长时间和系统的平均负载,uptime 命令最后输出的三个数字的含义分别是 1分钟,5分钟,15分钟内系统的平均负荷。
lsof(list open files)是一个列出当前系统打开文件的工具。通过 lsof 工具能够查看这个列表对系统检测及排错,常见的用法:
查看文件系统阻塞
lsof /boot
查看端口号被哪个进程占用
lsof -i : 3306
查看用户打开哪些文件
lsof –u username
查看进程打开哪些文件
lsof –p 4838
查看远程已打开的网络链接
lsof –i @192.168.34.128
perf 是 Linux kernel 自带的系统性能优化工具。优势在于与 Linux Kernel 的紧密结合,它可以最先应用到加入 Kernel 的new feature,用于查看热点函数,查看 cashe miss 的比率,从而帮助开发者来优化程序性能。
性能调优工具如 perf,Oprofile 等的基本原理都是对被监测对象进行采样,最简单的情形是根据 tick 中断进行采样,即在 tick 中断内触发采样点,在采样点里判断程序当时的上下文。
假如一个程序 90% 的时间都花费在函数 foo() 上,那么 90% 的采样点都应该落在函数 foo() 的上下文中。运气不可捉摸,但我想只要采样频率足够高,采样时间足够长,那么以上推论就比较可靠。因此,通过 tick 触发采样,我们便可以了解程序中哪些地方最耗时间,从而重点分析。
结合以上常用的性能测试命令并联系文初的性能分析工具的图,就可以初步了解到性能分析过程中哪个方面的性能使用哪方面的工具(命令)。
熟练并精通了第二部分的性能分析命令工具,引入几个性能测试的工具,介绍之前先简单了解几个性能测试工具:
github.com/brendangregg/flamegraph 中的开发源代码的程序生成。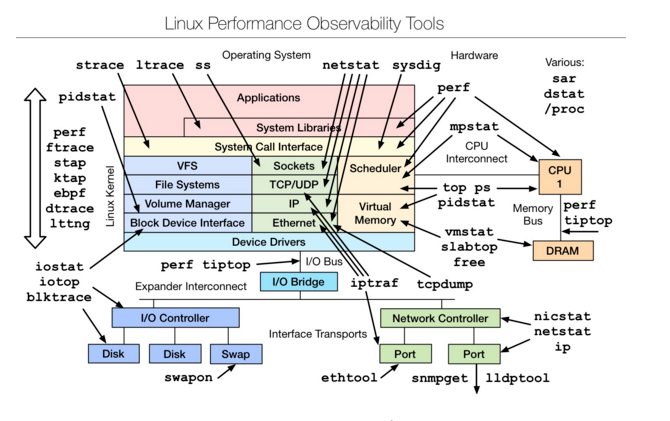
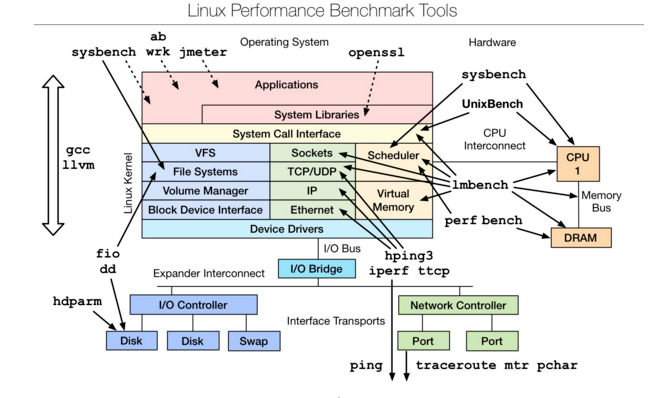
是一款性能测评工具,对于不同模块的性能测试可以使用相应的工具,想要深入了解,可以参考最下文的附件文档。
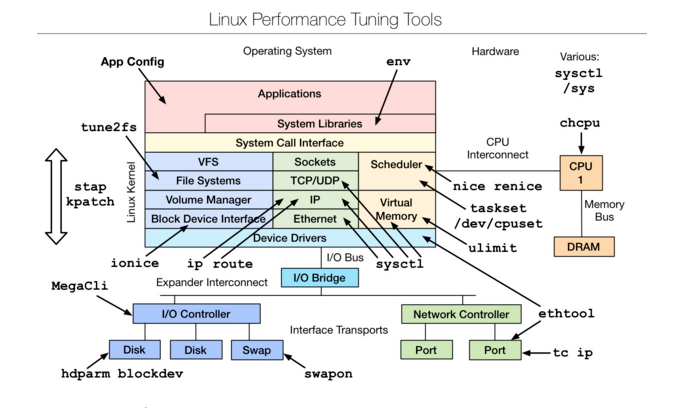
是一款性能调优工具,主要是从linux内核源码层进行的调优,想要深入了解,可以参考下文附件文档。
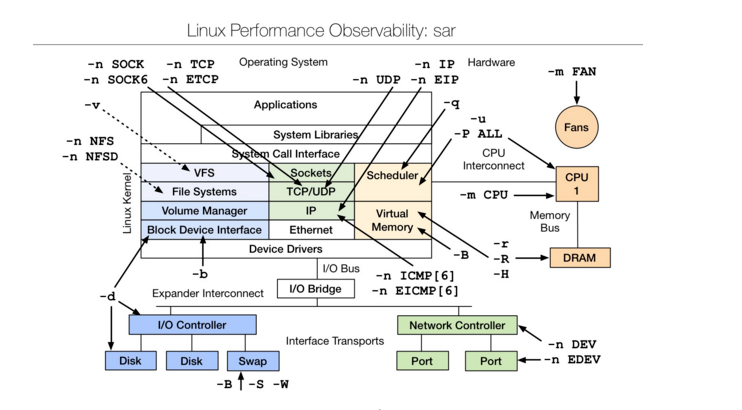
sar(System Activity Reporter系统活动情况报告)是目前LINUX上最为全面的系统性能分析工具之一,可以从多方面对系统的活动进行报告,包括:文件的读写情况、系统调用的使用情况、磁盘I/O、CPU效率、内存使用状况、进程活动及IPC 有关的活动等方面。sar 的常规使用方式:
sar [options] [-A] [-o file] t [n]
其中:t 为采样间隔,n 为采样次数,默认值是1;-o file 表示将命令结果以二进制格式存放在文件中,file 是文件名。options 为命令行选项
The above is the detailed content of Summary of Linux performance analysis tools. For more information, please follow other related articles on the PHP Chinese website!


![[Web front-end] Node.js quick start](https://img.php.cn/upload/course/000/000/067/662b5d34ba7c0227.png)


