


| Introduction | With the continuous development of the Internet, more and more needs in daily life are realized through the Internet. From food, clothing, housing and transportation to financial education, from pockets to identity, people rely on the Internet all the time, and more and more people People use the Internet to fulfill their needs. |
As a Web server that directly faces requests from customers, it will undoubtedly have to withstand more requests at the same time and provide users with a better experience. At this time, the performance of the web side often becomes a bottleneck for business development, and it is urgent to improve performance. The author of this article summarized some experiences in improving the performance of the Web server during the development process and shared them with everyone.
problem analysisFor the performance of the Web server, first we analyze the relevant indicators. From a user perspective, when a user calls a Web service, the shorter the request return time, the better the user experience. From a server perspective, the greater the number of user requests that can be carried at the same time, the stronger the server performance will be. Combining the two aspects, we summarize the two directions of performance optimization:
1. Increase the maximum number of concurrent requests that the server can support;
2. Improve the processing speed of each request.
The optimization direction is clarified. First, we introduce a common architectural pattern on the server side, that is, a Web request from a browser or App is processed and returned through several layers of structures on the server side.
Architecture mode: IP load balancing->cache server->reverse proxy->application server->database
As shown in Figure 1, for the convenience of explanation, let’s give a practical example: LVS(Keepalived)->Squid->nginx->Go->MySQL
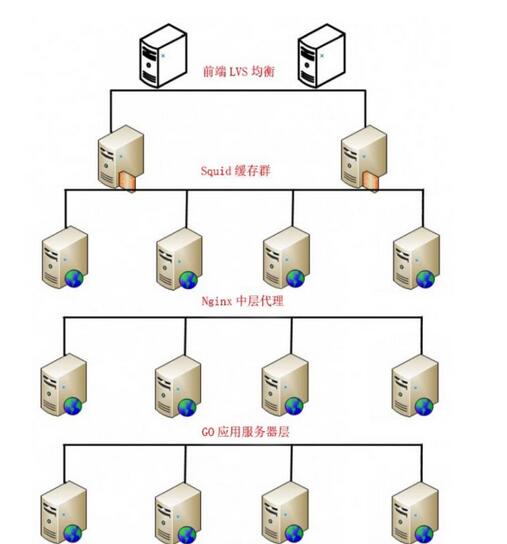
Figure 1: Server architecture
We distribute requests at each layer, so that multiple branches of the lower-level structure can work at the same time to increase the overall maximum number of concurrencies.
Combined with the architecture, we will analyze what problems usually hinder performance and find the corresponding solutions.
Under normal circumstances, IP load balancing, cache server and nginx proxy are mainly cluster stability issues. The places where performance bottlenecks are prone to occur are often the application server layer and the database layer. Let’s list a few examples:
1. Impact of blocking(1) Question:
Most web requests are blocking in nature. When a request is processed, the process will be suspended (occupying the CPU) until the request is completed. In most cases, web requests complete quickly enough that this problem is not a concern. However, for those requests that take a long time to complete (like requests that return large amounts of data or external APIs), this means that the application is locked until the end of processing. During this period, other requests will not be processed, and it is obvious that these are invalid. The waiting time is wasted and system resources are occupied, seriously affecting the number of concurrent requests we can afford.
(2) Solution:
While the Web server is waiting for the previous request to be processed, we can let the I/O loop open to process other application requests until the processing is completed, start a request and give feedback, instead of waiting for the request to be completed. The process is suspended. In this way, we can save some unnecessary waiting time and use this time to process more requests, so that we can greatly increase the throughput of requests, which means macroscopically increasing the number of concurrent requests we can handle.
(3) Example
Here we use Tornado, a Python web framework, to specifically explain how to change the blocking method to improve concurrency performance.
Scenario: We build a simple web application that sends HTTP requests to the remote end (a very stable website). During this period, network transmission is stable and we do not consider the impact of the network.
In this example, we use Siege (a stress testing software) to perform approximately 10 concurrent requests on the server within 10 seconds.
As shown in Figure 2, we can easily see that the problem here is that no matter how fast each request returns itself, the server's round trip to the remote access request will produce a large enough lag, because the process does not wait until the request is completed and The data is in a forced suspension state until it is processed. This isn't a problem yet with one or two requests, but when you get to 100 (or even 10) users it means an overall slowdown. As shown in the figure, the average response time of 10 similar users in less than 10 seconds reached 1.99 seconds, a total of 29 times. This example only shows very simple logic. If you add other business logic or database calls, the results will be even worse. When more user requests are added, the number of requests that can be processed at the same time will grow slowly, and some requests may even time out or fail.

Figure 2: Blocking response
Below we use Tornado to perform non-blocking HTTP requests.
As shown in Figure 3, we increased from 3.20 transactions per second to 12.59, serving a total of 118 requests in the same time period. This is really a big improvement! As you can imagine, as user requests increase and test times increase, it will be able to serve more connections without suffering the slowdowns suffered by the version above. This steadily increases the number of concurrent requests that can be loaded.
Web server performance improvement practice
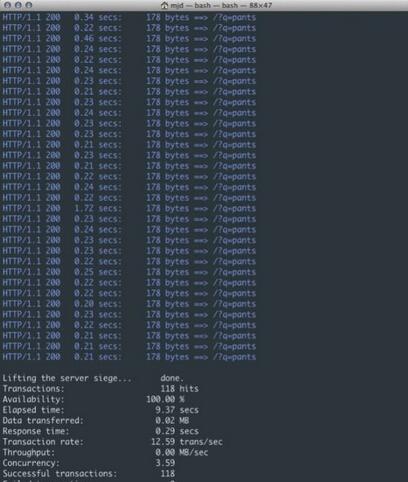
Figure 3: Non-blocking response
2. The impact of computing efficiency on response time and number of concurrenciesLet’s first introduce the basic knowledge: an application is a process running on the machine; a process is an independent execution body running in its own memory address space. A process consists of one or more operating system threads. These threads are actually execution bodies that work together and share the same memory address space.
(1) Question
The traditional computing method runs in a single thread, which has low efficiency and weak computing power.
(2) Solution
One solution is to avoid using threads entirely. For example, you can use multiple processes to offload the burden to the operating system. However, a disadvantage is that we have to handle all inter-process communication, which usually has more overhead than the shared memory concurrency model.
Another way is to use multi-threading to work. However, it is recognized that it is difficult to be accurate in applications using multi-threading, synchronize different threads, and lock the data, so that only one thread can change the data at the same time. However, past software development experience tells us that this will bring higher complexity, more error-prone code and lower performance.
The main problem is the sharing of data in memory, which will be operated in unpredictable ways by multiple threads, leading to some irreproducible or random results (called "race conditions"). So this classic approach is clearly no longer suitable for modern multi-core/multi-processor programming: the thread-per-connection model is not efficient enough. Among many suitable paradigms, there is one called Communicating Sequential Processes (CSP, invented by C. Hoare) and one called message-passing-model (already used in other languages). , such as Erlang).
The method we use here is to use a parallel architecture to process tasks. A concurrent program can use multiple threads to perform tasks on a processor or core, but only the same program can run on multiple cores or cores at a certain point in time. Real parallelism is possible on multiple processors.
Parallelism is the ability to increase speed by using multiple processors. So concurrent programs can be parallel or not.
Parallel mode can use multi-threads, multi-cores, multi-processors, and even multiple computers at the same time. This can undoubtedly mobilize more resources, thereby compressing response time, improving computing efficiency, and greatly enhancing the performance of the server.
(3) Example
Here we use Goroutine in Go language to explain specifically.
In the Go language, the concurrent processing part of the application is called goroutines (coroutines), which can perform more efficient concurrent operations. There is no one-to-one relationship between coroutines and operating system threads: coroutines are mapped (multiplexed, executed on) one or more threads based on their availability; the coroutine scheduler The Go runtime does this job very well. Coroutines are lightweight, lighter than threads. They are very inconspicuous (and use a small amount of memory and resources): they can be created in the heap using only 4K of stack memory. Because it is so cheap to create, it is easy to create and run a large number of coroutines (100,000 consecutive coroutines in the same address space) if necessary. And they divide the stack to dynamically increase (or reduce) the memory usage; the stack management is automatic, but not managed by the garbage collector, but automatically released after the coroutine exits. Coroutines can run between multiple operating system threads or within threads, allowing you to process a large number of tasks with a small memory footprint. Thanks to coroutine time slicing on operating system threads, you can have as many serving coroutines as you want using a small number of operating system threads, and the Go runtime can be smart about which coroutines are blocked and put them on hold. and handle other coroutines. Even programs can execute different code segments simultaneously on different processors and computers.
We usually want to divide a long calculation process into several pieces, and then let each goroutine be responsible for a piece of work, so that the response time for a single request is doubled.
For example, there is a task that is divided into three stages. Stage a goes to database a to get data, stage b goes to database b to get data, and stage c merges the data and returns it. After we start the goroutine, phases a and b can be carried out together, which greatly shortens the response time.
To put it bluntly, part of the calculation process is converted from serial to parallel. A task does not need to wait for other unrelated tasks to finish executing. Parallel execution of the program will be more useful in actual calculations.
I won’t go into too much detail about this part of the supporting data here. Interested students can look at this information for themselves. For example, the old story about the performance improvement of 15 times when the web server was switched from Ruby to Go (Ruby uses green threads, that is, only one CPU is utilized). While this story may be a bit exaggerated, there is no doubt about the performance gains that parallelism brings. (Ruby switching to Go: http://www.vaikan.com/how-we-went-from-30-servers-to-2-go/).
3. Impact of disk I/O on performance(1) Question
Disk reading data relies on mechanical movement. The time spent each time reading data can be divided into three parts: seek time, rotation delay, and transmission time. The seek time refers to the movement of the magnetic arm to the designated track. The time required for mainstream disks is generally less than 5ms; the rotation delay is the disk speed we often hear. For example, a disk with 7200 rpm means it can rotate 7200 times per minute, which means it can rotate 120 times per second. The rotation delay is 1/120/2 = 4.17ms; transmission time refers to the time to read from the disk or write data to the disk, generally a few tenths of a millisecond, which is negligible compared to the first two times. Then the time to access a disk, that is, the time for a disk I/O is approximately equal to 9ms (5ms 4.17ms), which sounds pretty good, but you must know that a 500-MIPS machine can execute 500 million instructions per second , because instructions rely on the nature of electricity. In other words, 400,000 instructions can be executed in the time it takes to execute one I/O. The database often contains hundreds of thousands, millions or even tens of millions of data, and each time it takes 9 milliseconds, it is obviously a disaster.
(2) Solution
There is no fundamental solution to the impact of disk I/O on server performance, unless you throw away the disk and replace it with something else. We can search the response speed and price of various storage media online. If you have money, you can change the storage media at will.
Without changing the storage medium, we can reduce the number of disk accesses by the application, such as setting up a cache, and we can also put some disk I/O outside the request cycle, such as using queues and stacks to process data. I/O etc.
4. Optimize database queryWith the changes in business development models, agile development is adopted by more and more teams, and the cycle is getting shorter and shorter. Many database query statements are written according to business logic. Over time, SQL queries are often ignored. format problems, causing increased pressure on the database and slowing down the response to database queries. Here is a brief introduction to several common problems and optimization methods that we have ignored in the MySQL database:
The leftmost prefix matching principle is a very important principle. MySQL will keep matching to the right until it encounters a range query (>, 3 and d = 4 If you create an index in the order (a, b, c, d), d will not use the index. If you create an index in (a, b, d, c), you can use it. a ,The order of b and d can be adjusted arbitrarily.
Try to choose columns with high distinction as indexes. The formula for distinction is count(distinct col)/count(*), which represents the proportion of fields that are not repeated. The larger the ratio, the fewer records we scan. The distinction of unique keys is 1. Some status and gender fields may have a distinction of 0 in the face of big data. Then someone may ask, does this ratio have any empirical value? Different usage scenarios make this value difficult to determine. Generally, we require fields that need to be joined to be above 0.1, that is, an average of 10 records will be scanned per one.
Try to use numeric fields. If fields contain only numerical information, try not to design them as character fields. This will reduce the performance of queries and connections, and increase storage overhead. This is because the engine will compare each character in the string one by one when processing queries and connections, and only one comparison is enough for numeric types.
Index columns cannot participate in calculations. Keep the columns "clean". For example, if from_unixtime(create_time) = '2014-05-29', the index cannot be used. The reason is very simple. The b-tree stores all field values in the data table, but When retrieving, you need to apply functions to all elements to compare, which is obviously too costly. Therefore, the statement should be written as create_time = unix_timestamp(’2014-05-29’); Try to avoid judging the null value of the field in the where clause, otherwise the engine will give up using it.
Perform a full table scan using the index, such as:
select id from t where num is null
You can set the default value 0 on num, make sure there is no null value in the num column in the table, and then query like this:
select id from t where num=0
Try to avoid using or in the where clause to link conditions, otherwise the engine will give up using the index and perform a full table scan, such as:
select id from t where num=10 or num=20
You can query like this:
select id from t where num=10 union all select id from t where num=20
The following query will also result in a full table scan (no leading percent sign):
select id from t where name like ‘�c%’
To improve efficiency, consider full-text search.
In and not in should also be used with caution, otherwise it will lead to a full table scan, such as:
select id from t where num in(1,2,3)
For continuous values, do not use in if you can use between:
select id from t where num between 1 and 3
The above is the detailed content of Web server performance improvement methods. For more information, please follow other related articles on the PHP Chinese website!


![[Web front-end] Node.js quick start](https://img.php.cn/upload/course/000/000/067/662b5d34ba7c0227.png)


