


Since we are in the IT industry, we need to deal with failures and problems every day, so we can be called firefighters, running around to solve problems. However, the scope of the fault this time is a bit large, and the host machine cannot be opened.
Fortunately, the monitoring system left some evidence.
Evidence found that the machine’s CPU, memory, and file handles continued to rise with the growth of business... until monitoring could not collect the information.
What’s terrible is that there are a lot of Java processes deployed on these hosts. For no other reason than to save costs, the applications were mixed. When a host exhibits overall anomalies, it can be difficult to find the culprit.
Since the remote login has expired, impatient operation and maintenance personnel can only choose to restart the machine and start restarting the application after the restart. After a long wait, all processes returned to normal operation, but after only a short period of time, the host machine suddenly crashed.
The business has been in a state of decline, which is really annoying. It also makes people anxious. After several attempts, the operation and maintenance collapsed, and the emergency plan was launched: rollback!
There were a lot of recent online records, and some developers went online and deployed privately, so the operation and maintenance was confused: rollback. Which ones? Fortunately, someone had a bright idea and remembered that there is also the find command. Then find all the recently updated jar packages and roll them back.
find /apps/deploy -mtime +3 | grep jar$
If you don’t know the find command, it’s really a disaster. Fortunately someone knows.
I rolled back more than a dozen jar packages. Fortunately, I didn’t encounter any database schema changes, and the system finally ran normally.
There is no other way, check the logs and conduct code review.
In order to ensure the quality of the code, the scope of the code review should be limited to code changes in the last 1 or 2 weeks, because some functional codes require a certain amount of time to mature before they can shine online.
Looking at the submission record "OK" that filled the screen, the technical manager's face turned green.
"xjjdog said, "80% of programmers can't write commit records", I think 100% of you can't write it."
Everyone was quiet, enduring the pain and checking the historical changes. After everyone's unremitting efforts, we finally found some problematic codes in the mountains of shit. A group created by the CxO himself, and everyone throws code that may cause problems into it.
"The system service was interrupted for nearly an hour, and the impact was very bad." The CxO said, "The problem must be completely solved. Investors are very concerned about this issue."!
okokok, with Nail With the help of nails, everyone's gestures became uniform.
There are a lot of codes, and everyone has been discussing the problematic code for a long time. This sentence can be rewritten as follows: We examined some complex code using parallel streams and nested within lambda expressions, paying special attention to the use of thread pools.
In the end everyone decided to go through the thread pool code again. One of the passages says this.
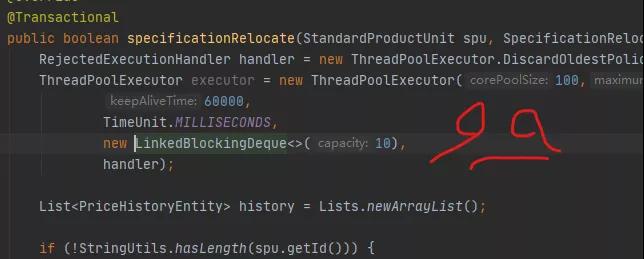
RejectedExecutionHandler handler = new ThreadPoolExecutor.DiscardOldestPolicy(); ThreadPoolExecutor executor = new ThreadPoolExecutor(100,200, 60000, TimeUnit.MILLISECONDS, new LinkedBlockingDeque(10), handler);
Not to mention, the parameters are decent, and even a rejection strategy is considered.
Java's thread pool makes programming very simple. These parameters cannot be reviewed without going through them one by one, as shown in the image above.
corePoolSize: The number of core threads. The core thread will survive after it is created.
maxPoolSize: The maximum number of threads
keepAliveTime: thread idle time
workQueue: blocking queue
threadFactory: thread creation factory
handler: rejection strategy
Let’s introduce their relationship below.
If the number of threads is less than the number of core threads and a new task arrives, the system will create a new thread to handle the task. If the current number of threads exceeds the number of core threads and the blocking queue is not full, the task will be placed in the blocking queue. When the number of threads is greater than the number of core threads and the blocking queue is full, new threads will be created to serve until the number of threads reaches the maximumPoolSize size. At this time, if there are new tasks, the rejection policy will be triggered.
Let’s talk about the rejection strategy. JDK has 4 built-in policies, the default of which is AbortPolicy, which directly throws an exception. Several others are introduced below.
DiscardPolicy is more radical than abort. It directly discards the task without even exception information.
Task processing is performed by the calling thread. This is How CallerRunsPolicy is implemented. When the thread pool resources of a web application are full, new tasks will be assigned to Tomcat threads for execution. In some cases, this method can reduce the execution pressure of some tasks, but in more cases, it will directly block the running of the main thread
DiscardOldestPolicy discards the front of the queue Task, and then try to execute the task again
This thread pool code is newly added, and the parameter settings are also reasonable, and there is no big problem. Using the DiscardOldestPolicy rejection policy is the only possible risk. When there are a lot of tasks, this rejection policy will cause tasks to be queued and requests to time out.
Of course we cannot let go of this risk. To be honest, it is the most likely risk code that can be found so far.
"Change DiscardOldestPolicy to the default AbortPolicy, repackage it and try it online." The technical guru said in the group.
As a result, after the grayscale service was launched, the host died shortly after. It's the reason why it didn't run, but why?
The size of the thread pool, the minimum is 100, the maximum is 200, nothing is too much. The capacity of the blocking queue is only 10, so nothing will cause a problem. If you say it's caused by this thread pool, I won't believe you even to death.
But the business department reported that if this code is added, it will die, but if it is not added, it will be fine. The technical experts are scratching their heads and wondering about her sister.
In the end, someone finally couldn't help it anymore and downloaded the business code to debug it.
When he opened Idea, he was instantly confused and then understood instantly. He finally understood why this code caused problems.
The thread pool is actually created in the method!
When every request comes, it will create a thread pool until the system restarts Resources cannot be allocated.
It’s so domineering.
Everyone is paying attention to how the parameters of the thread pool are set, but no one has ever doubted the location of this code.
The above is the detailed content of Server failure instance analysis. For more information, please follow other related articles on the PHP Chinese website!


![[Web front-end] Node.js quick start](https://img.php.cn/upload/course/000/000/067/662b5d34ba7c0227.png)


