| Medium |
Unstable |
Good |
No |
| ##Ce tree classification algorithm
1. Construct a data set
In order to facilitate processing, the simulation data is converted into numerical list data according to the following rules:
Age: < ;30 is assigned a value of 0; 30-40 is assigned a value of 1; >40 is assigned a value of 2
Income: low is 0; medium is 1; high is 2
Work nature: unstable 0; stable is 1
Credit rating: poor is 0; good is 1
#创建数据集
def createdataset():
    dataSet=[[0,2,0,0,'N'],
            [0,2,0,1,'N'],
            [1,2,0,0,'Y'],
            [2,1,0,0,'Y'],
            [2,0,1,0,'Y'],
            [2,0,1,1,'N'],
            [1,0,1,1,'Y'],
            [0,1,0,0,'N'],
            [0,0,1,0,'Y'],
            [2,1,1,0,'Y'],
            [0,1,1,1,'Y'],
            [1,1,0,1,'Y'],
            [1,2,1,0,'Y'],
            [2,1,0,1,'N'],]
    labels=['age','income','job','credit']
    return dataSet,labels
Copy after login
Call the function to get data:
ds1,lab = createdataset()
print(ds1)
print(lab)
Copy after login
[[0, 2 , 0, 0, ‘N’], [0, 2, 0, 1, ‘N’], [1, 2, 0, 0, ‘Y’], [2, 1, 0, 0, ‘Y’], [2, 0, 1, 0, ‘Y’], [2, 0, 1, 1, ‘N’], [1, 0, 1, 1, ‘Y’] , [0, 1, 0, 0, ‘N’], [0, 0, 1, 0, ‘Y’], [2, 1, 1, 0, ‘Y’], [0, 1 , 1, 1, ‘Y’], [1, 1, 0, 1, ‘Y’], [1, 2, 1, 0, ‘Y’], [2, 1, 0, 1, ‘N’]]
[‘age’, ‘income’, ‘job’, ‘credit’]
2. Data set information entropy
Information entropy, also known as Shannon entropy, is the expectation of random variables. Measures the degree of uncertainty of information. The greater the entropy of information, the harder it is to figure out the information. Processing information is to clarify the information, which is the process of entropy reduction.
def calcShannonEnt(dataSet):
    numEntries = len(dataSet)
    labelCounts = {}
    for featVec in dataSet:
        currentLabel = featVec[-1]
        if currentLabel not in labelCounts.keys():
            labelCounts[currentLabel] = 0

        labelCounts[currentLabel] += 1

    shannonEnt = 0.0
    for key in labelCounts:
        prob = float(labelCounts[key])/numEntries
        shannonEnt -= prob*log(prob,2)

    return shannonEnt
Copy after login
Sample data information entropy:
shan = calcShannonEnt(ds1)
print(shan)
Copy after login
0.9402859586706309
3. Information gain
Information gain: used to measure attribute A Reduce the contribution of the sample set X entropy. The greater the information gain, the more suitable it is for classifying X.
def chooseBestFeatureToSplit(dataSet):
    numFeatures = len(dataSet[0])-1
    baseEntropy = calcShannonEnt(dataSet)
    bestInfoGain = 0.0;bestFeature = -1
    for i in range(numFeatures):
        featList = [example[i] for example in dataSet]
        uniqueVals = set(featList)
        newEntroy = 0.0
        for value in uniqueVals:
            subDataSet = splitDataSet(dataSet, i, value)
            prop = len(subDataSet)/float(len(dataSet))
            newEntroy += prop * calcShannonEnt(subDataSet)
        infoGain = baseEntropy - newEntroy
        if(infoGain > bestInfoGain):
            bestInfoGain = infoGain
            bestFeature = i
    return bestFeature
Copy after login
The above code implements the ID3 decision tree learning algorithm based on information entropy gain. Its core logical principle is: select each attribute in the attribute set in turn, and divide the sample set into several subsets according to the value of this attribute; calculate the information entropy of these subsets, and the difference between it and the information entropy of the sample is based on The information entropy gain of this attribute segmentation; find the attribute corresponding to the largest gain among all gains, which is the attribute used to segment the sample set.
Calculate the best split sample attribute of the sample, and the result is displayed in column 0, which is the age attribute:
col = chooseBestFeatureToSplit(ds1)
col
Copy after login
0
4. Construction decision The tree
def majorityCnt(classList):
    classCount = {}
    for vote in classList:
        if vote not in classCount.keys():classCount[vote] = 0
        classCount[vote] += 1
    sortedClassCount = sorted(classList.iteritems(),key=operator.itemgetter(1),reverse=True)#利用operator操作键值排序字典
    return sortedClassCount[0][0]

#创建树的函数
def createTree(dataSet,labels):
    classList = [example[-1] for example in dataSet]
    if classList.count(classList[0]) == len(classList):
        return classList[0]
    if len(dataSet[0]) == 1:
        return majorityCnt(classList)
    bestFeat = chooseBestFeatureToSplit(dataSet)
    bestFeatLabel = labels[bestFeat]
    myTree = {bestFeatLabel:{}}
    del(labels[bestFeat])
    featValues = [example[bestFeat] for example in dataSet]
    uniqueVals = set(featValues)
    for value in uniqueVals:
        subLabels = labels[:]
        myTree[bestFeatLabel][value] = createTree(splitDataSet(dataSet, bestFeat, value), subLabels)

    return myTree
Copy after login
majorityCnt function is used to handle the following situation: when the final ideal decision tree should reach the bottom along the decision branch, all samples should have the same classification result. However, in real samples, it is inevitable that all attributes are consistent but the classification results are different. In this case, majorityCnt adjusts the classification labels of such samples to the classification result with the most occurrences.
createTree is the core task function. It calls the ID3 information entropy gain algorithm for all attributes in sequence to calculate and process, and finally generates a decision tree.
5. Construct a decision tree by instantiation
Use sample data to construct a decision tree:
Tree = createTree(ds1, lab)
print("样本数据决策树:")
print(Tree)
Copy after login
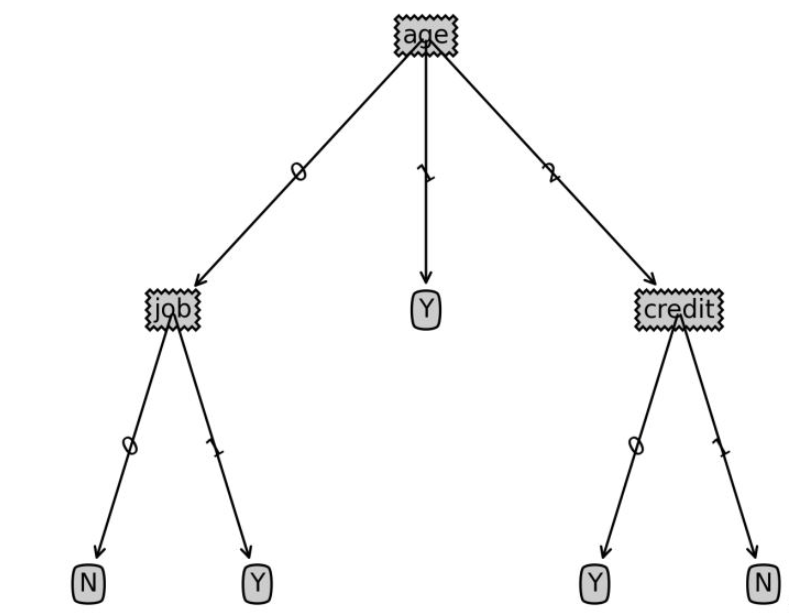
Sample data decision tree:
{‘age’: {0: {‘job’: {0: ‘N’, 1: ‘Y’}},
1: ‘Y’,
2: {‘credit’: {0: ‘Y’, 1: ‘N’}}}}
6. Test sample classification
Give a new user Information to determine whether he or she will buy a certain product:
##Age | Income range | Nature of work | Credit rating |
##<30| Low | Stable | Good | |
<30| High | Unstable | Good | |
def classify(inputtree,featlabels,testvec):
    firststr = list(inputtree.keys())[0]
    seconddict = inputtree[firststr]
    featindex = featlabels.index(firststr)
    for key in seconddict.keys():
        if testvec[featindex]==key:
            if type(seconddict[key]).__name__=='dict':
                classlabel=classify(seconddict[key],featlabels,testvec)
            else:
                classlabel=seconddict[key]
    return classlabel
Copy after login
labels=['age','income','job','credit']
tsvec=[0,0,1,1]
print('result:',classify(Tree,labels,tsvec))
tsvec1=[0,2,0,1]
print('result1:',classify(Tree,labels,tsvec1))
Copy after login
result: Yresult1: N
Post information: Drawing decision tree code
The following code is used to draw decision tree graphics, not the focus of the decision tree algorithm. If you are interested, you can refer to it for learning
import matplotlib.pyplot as plt

decisionNode = dict(box, fc="0.8")
leafNode = dict(box, fc="0.8")
arrow_args = dict(arrow)

#获取叶节点的数目
def getNumLeafs(myTree):
    numLeafs = 0
    firstStr = list(myTree.keys())[0]
    secondDict = myTree[firstStr]
    for key in secondDict.keys():
        if type(secondDict[key]).__name__=='dict':#测试节点的数据是否为字典,以此判断是否为叶节点
            numLeafs += getNumLeafs(secondDict[key])
        else:   numLeafs +=1
    return numLeafs

#获取树的层数
def getTreeDepth(myTree):
    maxDepth = 0
    firstStr = list(myTree.keys())[0]
    secondDict = myTree[firstStr]
    for key in secondDict.keys():
        if type(secondDict[key]).__name__=='dict':#测试节点的数据是否为字典,以此判断是否为叶节点
            thisDepth = 1 + getTreeDepth(secondDict[key])
        else:   thisDepth = 1
        if thisDepth > maxDepth: maxDepth = thisDepth
    return maxDepth

#绘制节点
def plotNode(nodeTxt, centerPt, parentPt, nodeType):
    createPlot.ax1.annotate(nodeTxt, xy=parentPt,  xycoords='axes fraction',
             xytext=centerPt, textcoords='axes fraction',
             va="center", ha="center", bbox=nodeType, arrowprops=arrow_args )

#绘制连接线
def plotMidText(cntrPt, parentPt, txtString):
    xMid = (parentPt[0]-cntrPt[0])/2.0 + cntrPt[0]
    yMid = (parentPt[1]-cntrPt[1])/2.0 + cntrPt[1]
    createPlot.ax1.text(xMid, yMid, txtString, va="center", ha="center", rotation=30)

#绘制树结构
def plotTree(myTree, parentPt, nodeTxt):#if the first key tells you what feat was split on
    numLeafs = getNumLeafs(myTree)  #this determines the x width of this tree
    depth = getTreeDepth(myTree)
    firstStr = list(myTree.keys())[0]     #the text label for this node should be this
    cntrPt = (plotTree.xOff + (1.0 + float(numLeafs))/2.0/plotTree.totalW, plotTree.yOff)
    plotMidText(cntrPt, parentPt, nodeTxt)
    plotNode(firstStr, cntrPt, parentPt, decisionNode)
    secondDict = myTree[firstStr]
    plotTree.yOff = plotTree.yOff - 1.0/plotTree.totalD
    for key in secondDict.keys():
        if type(secondDict[key]).__name__=='dict':#test to see if the nodes are dictonaires, if not they are leaf nodes
            plotTree(secondDict[key],cntrPt,str(key))        #recursion
        else:   #it's a leaf node print the leaf node
            plotTree.xOff = plotTree.xOff + 1.0/plotTree.totalW
            plotNode(secondDict[key], (plotTree.xOff, plotTree.yOff), cntrPt, leafNode)
            plotMidText((plotTree.xOff, plotTree.yOff), cntrPt, str(key))
    plotTree.yOff = plotTree.yOff + 1.0/plotTree.totalD

#创建决策树图形
def createPlot(inTree):
    fig = plt.figure(1, facecolor='white')
    fig.clf()
    axprops = dict(xticks=[], yticks=[])
    createPlot.ax1 = plt.subplot(111, frameon=False, **axprops)    #no ticks
    #createPlot.ax1 = plt.subplot(111, frameon=False) #ticks for demo puropses
    plotTree.totalW = float(getNumLeafs(inTree))
    plotTree.totalD = float(getTreeDepth(inTree))
    plotTree.xOff = -0.5/plotTree.totalW; plotTree.yOff = 1.0;
    plotTree(inTree, (0.5,1.0), '')
    plt.savefig('决策树.png',dpi=300,bbox_inches='tight')
    plt.show()
Copy after login


![[Web front-end] Node.js quick start](https://img.php.cn/upload/course/000/000/067/662b5d34ba7c0227.png)


