


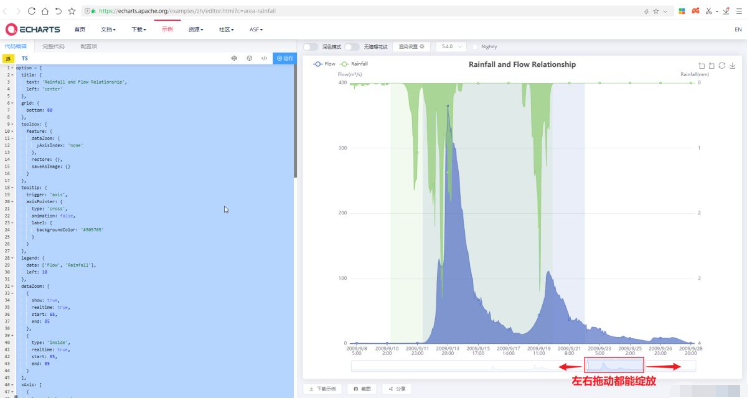
1. Open the echarts official website example: https://echarts.apache.org/examples/zh/editor.html?c=area-rainfall
The zoom function of this example is normal. As shown below:
After copying the above demo options to the local environment, everything goes fine when starting to render, but when trying to drag When moving the zoom handles, a JavaScript error occurs. As shown below:
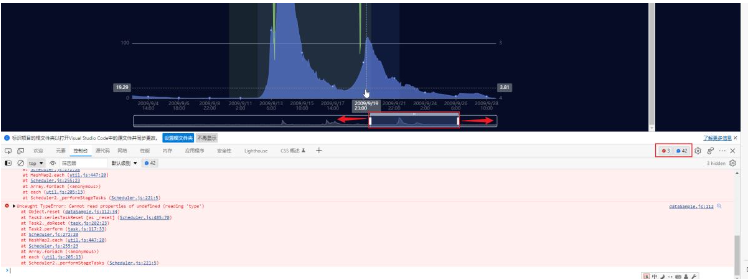
Click to enter the error stack and find that the coordinateSystem property of the seriesModel is reported to be undefined
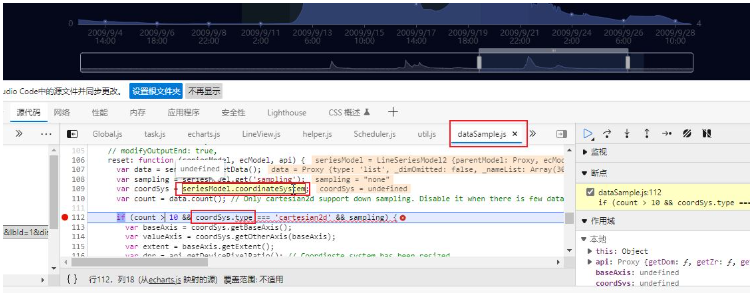
I thought it was at first The echarts version is inconsistent with the version on the official website. As a result, the echarts version of the local machine is updated to be consistent with the echarts version on the official website. I compared the echarts download from the official website with the echarts on my local machine and found that the two are consistent.
The key points are two sentences, as shown below:
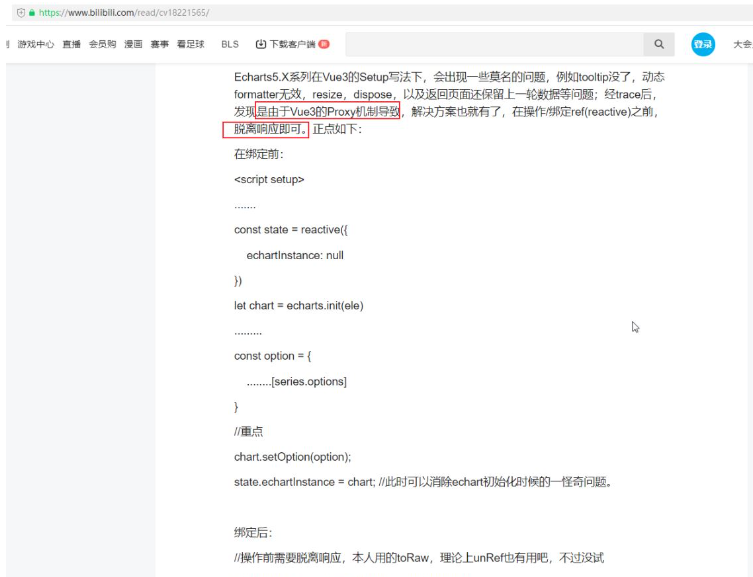
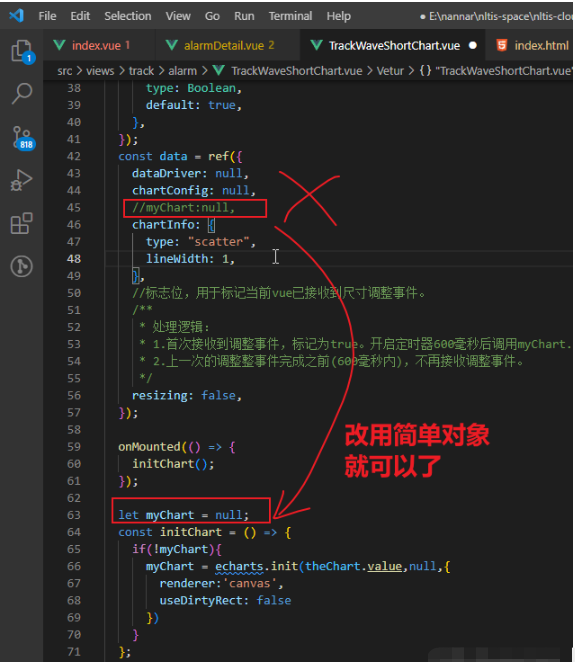
I modified the code because my Vue 2 code needs to be upgraded to Vue 3. In the vue2 version, the myChart object is placed in data. Upgrading to vue3 is just a simple code rewrite, and myChart is still placed in data. The code is as follows:
const data = ref({
dataDriver: null,
chartConfig: null,
myChart: null
});The objects bound to ref in vue3 are all responsive objects, and changes in attribute values in the objects are intercepted by vue3's proxy.
Therefore, if the value is responsively bound to the page content, it should be placed in the data, and my chart is drawn by myself using the native echarts api, so there is no need to do responsive binding. If the chart is drawn When the data changes, I will manually call echarts to redraw it. So I just need to delete myChart from data and put it outside. As shown below:
The above is the detailed content of How to solve the problem that echarts cannot be scaled in Vue3. For more information, please follow other related articles on the PHP Chinese website!


![[Web front-end] Node.js quick start](https://img.php.cn/upload/course/000/000/067/662b5d34ba7c0227.png)


