


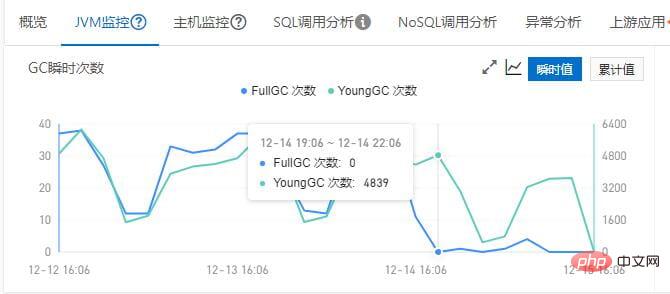
Daily inspection found that frequent full gc appeared on the application line
Frequent full gc appeared on the application line
Pull the dump file: Interlude: If you specify:live when dumping, the jvm will do it first before dumping full gc, and dump full gc will be printed in the gc log. This kind of troubleshooting for online abnormal memory conditions not caused by memory leaks will bring inconvenience, causing us to dump several times.
Analyze the dump file:
a. It was found that a large number of long[] arrays occupy the maximum space, and there are exceptions

b . Check the gc root node and find that most of these long[] data are held by org.HdrHistogram.Histogram. Each Histogram object will hold a 2048size long[]
c. Check the number of Histogram instances. , there are actually 50,000. Compared with the stack of normal projects, it is about 100 times

d. Here is another episode. I used to use mat analysis at the beginning. However, the report generated by mat is more useful for analyzing leaks. For analyzing abnormal memory, it is not as easy to use as jvisualvm.exe and idea profiler
Start locally and you can reproduce this type of memory Usage, so I started a local service with normal memory and the problematic application to analyze the memory comparison
The profiler of idea is used here, which is very convenient
Discover the difference:
Compared with normal applications, it is found that the references of the abnormal applications have abnormal references from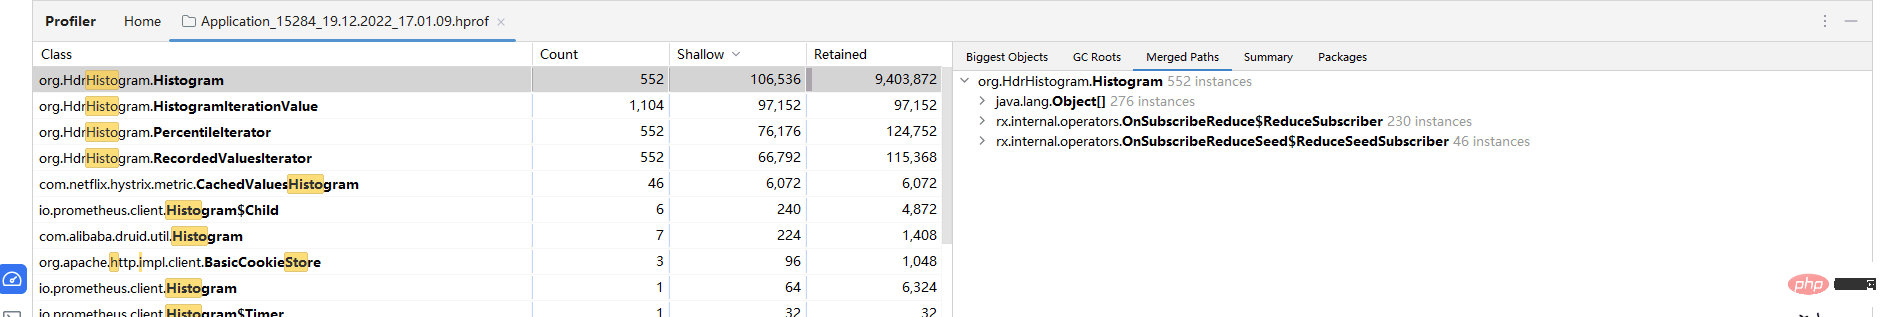

Metric is used by Hystrix to count relevant indicators for its own dashboard or users to obtain, so as to understand the system circuit breaker. Functions of parameters and indicators
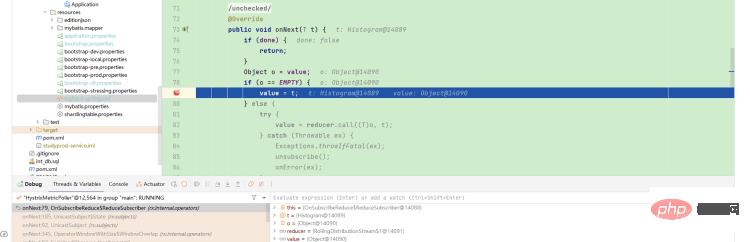
Looking at the stack again, the logic to get here is

Histogram itself is used by Hystrix to implement a bucket sliding window-like function to count traffic per unit time, but because the indicator parameters are turned on, hystrix In order to count indicators in a longer time range, a new object holds more Histogram references (unit time) for aggregation. Because these references are used to count longer time range periods, they will be held for a long time because the references are held for a long time. In the old age, the essence is not a memory leak, so it can be recycled after each full gc.
After adding the configuration, verify and view the stack, the references return to normal, and the system does not add more Histogram instances after a period of time. After releasing it online and observing for a period of time, the full gc problem is indeed solved.
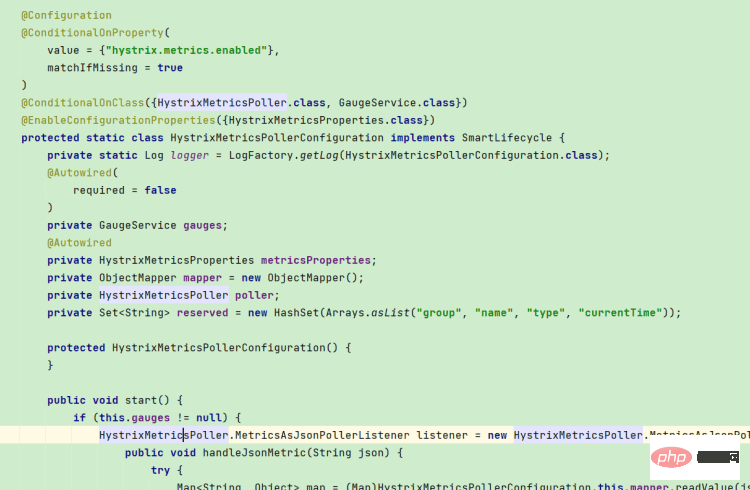
After searching the source code, the opening of this class is related to an annotation.

After comparing the code, it turns out that only the abnormal application uses this annotation. The purpose of this annotation is to turn on the circuit breaker
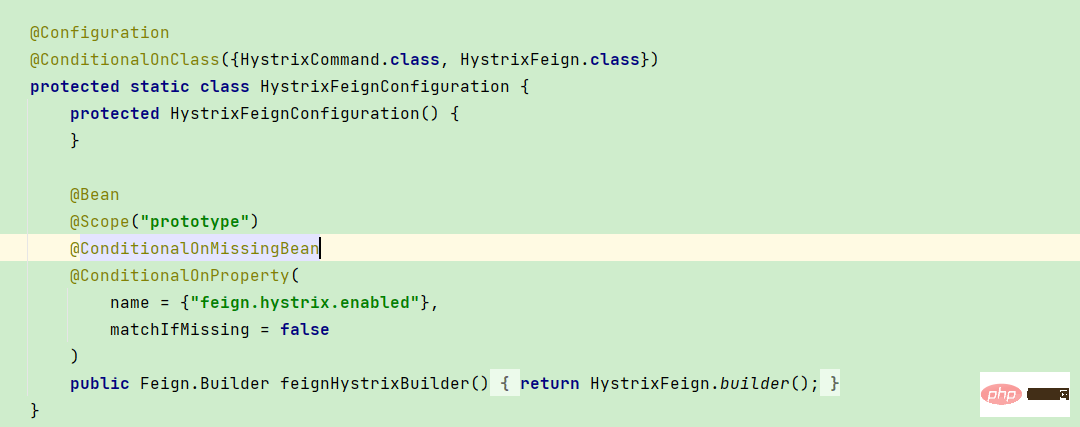
But after research, it was found that without using this annotation, functions such as circuit breakers are still available. The reason is that after the spring-cloud version, spring uses hystrix to encapsulate openfeign. Instead of integrating the entire hystrix system, spring-cloud may have also discovered problems with hystrix memory usage
So in higher versions (at least our version), feign is switched on and off through feign.hystrix.enabled Circuit breaker (if this switch is turned off, simply adding the @EnableCircuitBreaker annotation to the circuit breaker will not take effect)
In fact, in higher versions of spring-cloud, the @EnableCircuitBreaker annotation has been marked as obsolete. , but maybe because we are an intermediate version, there are situations where it is neither marked as abandoned nor actually useful.
In short, the circuit breaking function of feign is only controlled by feign.hystrix.enabled, after adding the @EnableCircuitBreaker annotation It will just open all other indicators and other functions of Hystrix
The above is the detailed content of How to solve the problem of frequent full gc due to abnormal use of Java memory. For more information, please follow other related articles on the PHP Chinese website!


![[Web front-end] Node.js quick start](https://img.php.cn/upload/course/000/000/067/662b5d34ba7c0227.png)


