
As AllInOne’s intelligent service technology stack, UAVStack provides a very comprehensive monitoring data sampling function and supports data monitoring and early warning. Recently, we have integrated the original data collection and display functions, added JVM analysis functions, and launched a more easy-to-use JVM monitoring and analysis tool.
Developers who are familiar with JDK know that JDK itself provides a set of JVM analysis tools, including jinfo, jmap, jstack, etc. Users can easily obtain JVM memory stack information, memory object allocation, and basic JVM startup parameter information through the command line. However, these tools need to be executed in a command line environment, and in a production environment they need to be forwarded through the bastion host.
Some good JVM analysis tools in the open source community can also provide functions such as obtaining basic JVM information, tracing stacks, and obtaining memory information, but they also require the support of the command line CLI.
The JVM monitoring and analysis tool launched by UAVStack provides a page-based display method to graphically display the collected monitoring data; it also provides basic JVM parameter acquisition, memory dump, thread analysis, memory allocation sampling and hot spots. Method analysis and other functions.
The JVM monitoring and analysis tool is based on the existing architecture of UAVStack and is divided into front-end, back-end and middleware enhanced framework (MOF). Among them:
The front-end is responsible for displaying data and sending user execution instructions to the background;
The background is responsible for issuing instructions, responding to user queries, and processing collection The data received;
The middleware enhancement framework (MOF) is responsible for receiving the instructions issued by the background, executing the instructions and returning the data or writing the data to the file, and then returns the file provided by UAV. Set function to upload data.
The overall architecture process is shown in the figure below:

JMX provides relevant interfaces to obtain basic JVM monitoring data, such as memory heap size, GC status, etc., which is the basis of JVM monitoring data.
As the basis of the entire link of analysis tools, MOF is dependent on user applications and mainly provides the following basic support:
Basic data collection: When MOF is embedded in an application, JMX regularly obtains and reports basic information data of relevant JVMs, providing a data basis for display and early warning.
Request capture, instruction execution: Most functions of JVM monitoring and analysis tools require issuing instructions to the server where the application is located. MOF is responsible for intercepting requests to issue instructions, executing them and returning corresponding results.
Java Attach API is a set of non-standard APIs provided by Sun, which can connect users to running virtual machine processes for Agent mounting and other operations.
In the JVM monitoring and analysis tool, the Java Attach API is mainly used to Attach to the virtual machine process and perform the following operations:
Get JMX Connection: Get the JVMConnection from the outside, Get MXBean and capture running data. (CPU sampling analysis)
Get the VirtualMachine object: call the interface to get the heap memory distribution information. (Memory sampling analysis)
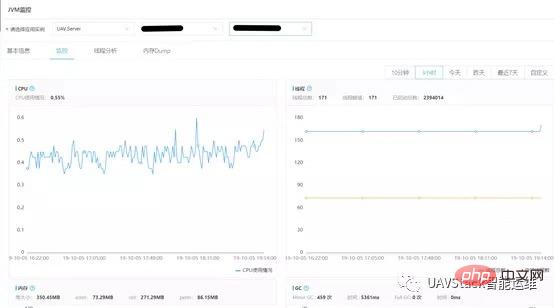
After selecting the application instance, you can enter the basic monitoring page.
This page mainly displays CPU usage, thread status, memory usage and GC status. Users can adjust the time range according to needs and view monitoring data in different periods.
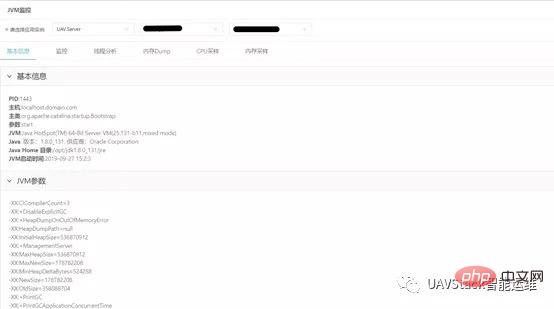
The JVM summary page displays the basic parameter information of the current virtual machine, including basic information, JVM parameters and system properties. Among them:
Basic information includes the most basic and important information such as pid, host information, startup parameters, and JVM startup time;
JVM parameters include all JVM startup parameters. Users can view the specified heap size, garbage collector information, etc.;
System properties include all configuration information written in System.Properties and Javaagent Configuration properties.
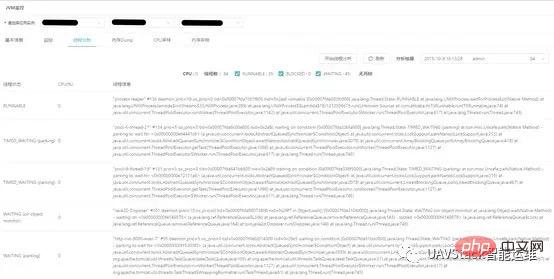
Thread analysis obtains the basic information of the thread by executing jstack, and analyzes the output results to obtain the thread status Quantity, deadlock and other information.
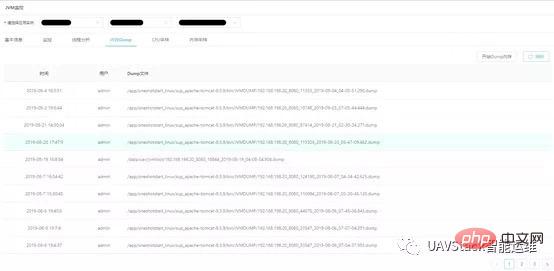
Memory Dump obtains the stack dump file of the specified JVM by executing jmap.
Users can easily generate dumps on the front end with one click without logging in to the bastion machine. Click "Refresh" to view recent dump memory operation records.
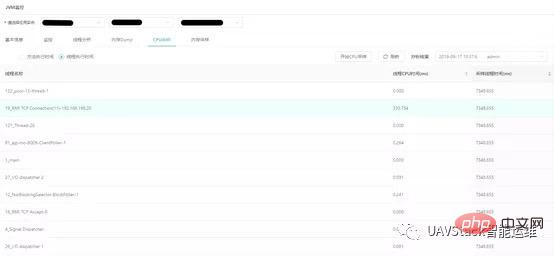
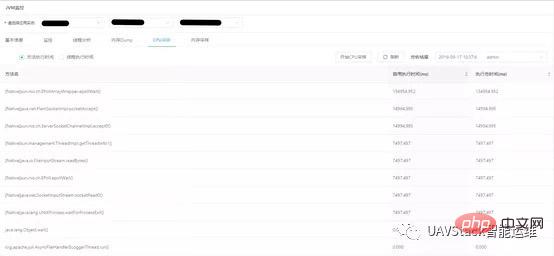
CPU analysis is based on thread stack sampling analysis and mainly provides two functions: thread execution time and method hotspot sampling.
Thread execution time refers to the activity time of the thread during the sampling period. The query results are sorted according to the total thread activity time, and the thread name and thread execution time information are also provided, so that users can judge the execution status of the application.
Method hotspot sampling counts the execution time of all methods and provides class name and method name information of the method. Among them, the self-execution time of a method does not include the execution time of the method calling other methods. The query results are sorted in descending order according to the self-execution time of the method. Users can view the longer execution methods within the current application to determine whether the application is abnormal and needs optimization.
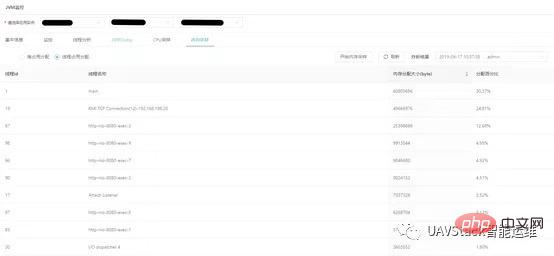
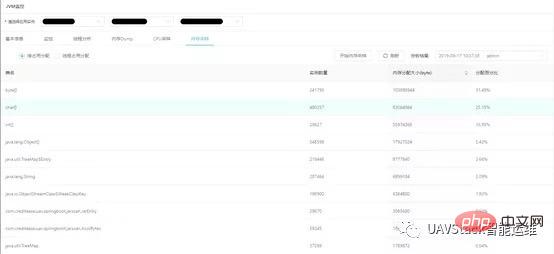
Memory analysis is a statistical sampling analysis based on threads and heaps. It mainly provides two functions: each Thread memory allocation and heap allocation details.
Thread memory allocation provides information such as the memory allocation size and thread name of each thread, arranged in descending order according to the memory allocation size. Users can view the threads currently occupying a large amount of memory.
In-heap allocation provides the number of allocated instances of each class in the heap and the heap memory occupied. According to the heap Sort by memory size in descending order. Users can use this function as a simple dump and analysis tool to quickly analyze memory allocation and discover memory allocation problems.
The above is the detailed content of How to use JVM monitoring and analysis tools in UAVStack. For more information, please follow other related articles on the PHP Chinese website!


