


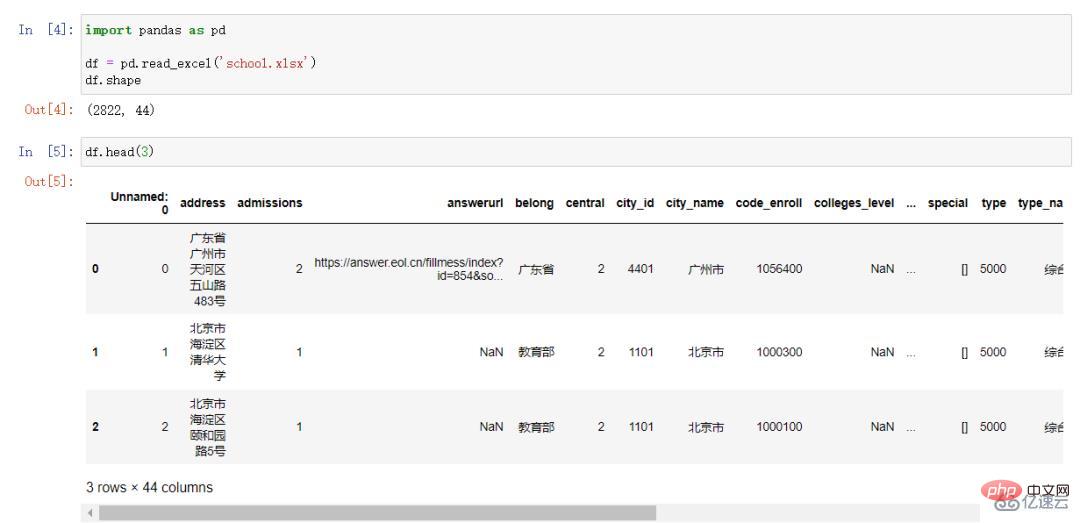
To display the distribution of colleges and universities, you must first obtain the location data of colleges and universities across the country. The data for this article comes from the Palm College Entrance Examination Network
. When writing this article in June 2022, a total of 2,822 colleges and universities information was obtained. After checking the data, except for a few null values, the entire data is very complete and does not affect use. The data has a total of 44 fields. This article will only use a few fields. They do not need to be processed and can be obtained on demand when using them.
Introduction to data acquisition methods (basic crawler knowledge):
1. Register and log in to the Palm College Entrance Examination Network. Select all schools on the
2. Press the F12 key, click Network > Fetch/XHR, and then click
4. After successfully calling Baidu Map API, read the locations of all colleges and universities, call the above function in sequence, obtain the longitude and latitude of all colleges and universities, and rewrite it into excel.
import pandas as pd
import numpy as np


def get_lng_lat():
df = pd.read_excel('school.xlsx')
lng_lat = []
for row_index, row_data in df.iterrows():
addr = row_data['address']
if addr is np.nan:
addr = row_data['city_name'] + row_data['county_name']
# print(addr)
loc = baidu_api(addr.split(',')[0])
lng_lat.append(loc)
df['经纬度'] = lng_lat
df['经度'] = df['经纬度'].apply(lambda x: x['lng'])
df['纬度'] = df['经纬度'].apply(lambda x: x['lat'])
df.to_excel('school_lng_lat.xlsx')
The final data result is as shown below:
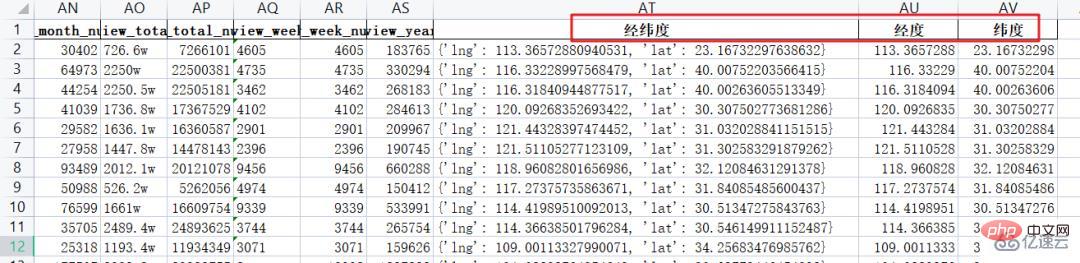
Individual developers need to pay attention when using the Baidu Map open platform. There is a daily quota limit, so when debugging the code first Don’t use all the data, run through the demo first, otherwise you have to wait a day or buy credits.

The data is ready, let’s display them on the map.
This article uses Baidu’s open source data visualization tool Echarts. Echarts provides the pyecharts library for the Python language, which is very convenient to use.
Installation command:
pip install pyecharts
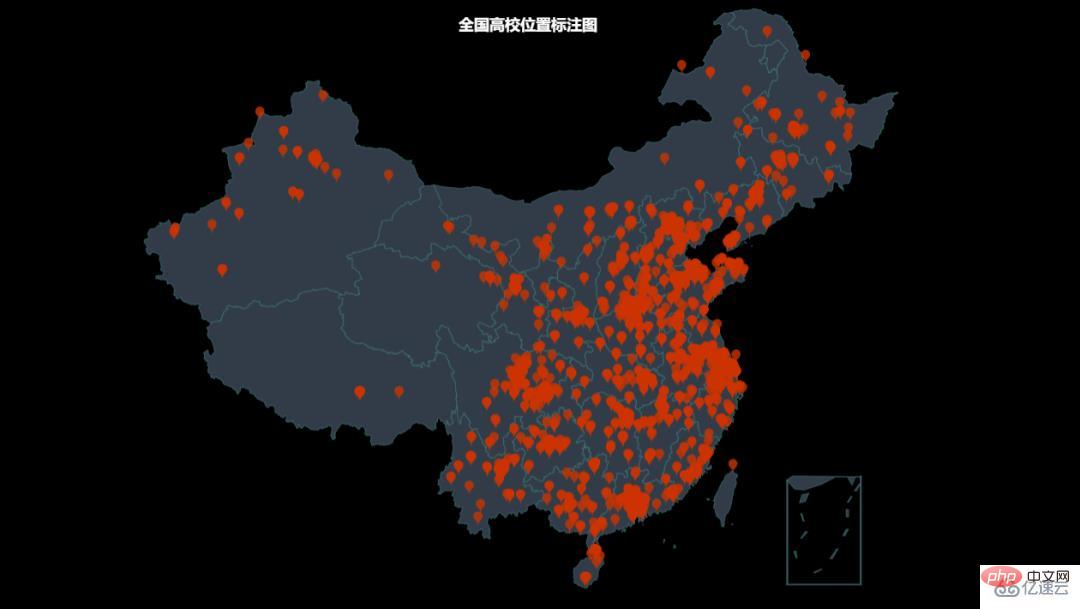
1. Mark the location of colleges and universities
from pyecharts.charts import Geo
from pyecharts import options as opts
from pyecharts.globals import GeoType
import pandas as pd

def multi_location_mark():
"""批量标注点"""
geo = Geo(init_opts=opts.InitOpts(bg_color='black', width='1600px', height='900px'))
df = pd.read_excel('school_lng_lat.xlsx')
for row_index, row_data in df.iterrows():
geo.add_coordinate(row_data['name'], row_data['经度'], row_data['纬度'])
data_pair = [(name, 2) for name in df['name']]
geo.add_schema(
maptype='china', is_roam=True, itemstyle_opts=opts.ItemStyleOpts(color='#323c48', border_color='#408080')
).add(
'', data_pair=data_pair, type_=GeoType.SCATTER, symbol='pin', symbol_size=16, color='#CC3300'
).set_series_opts(
label_opts=opts.LabelOpts(is_show=False)
).set_global_opts(
title_opts=opts.TitleOpts(title='全国高校位置标注图', pos_left='650', pos_top='20',
title_textstyle_opts=opts.TextStyleOpts(color='white', font_size=16))
).render('high_school_mark.html')
from pyecharts.charts import Geo
from pyecharts import options as opts
from pyecharts.globals import ChartType
import pandas as pd

def draw_location_heatmap():
"""绘制热力图"""
geo = Geo(init_opts=opts.InitOpts(bg_color='black', width='1600px', height='900px'))
df = pd.read_excel('school_lng_lat.xlsx')
for row_index, row_data in df.iterrows():
geo.add_coordinate(row_data['name'], row_data['经度'], row_data['纬度'])
data_pair = [(name, 2) for name in df['name']]
geo.add_schema(
maptype='china', is_roam=True, itemstyle_opts=opts.ItemStyleOpts(color='#323c48', border_color='#408080')
).add(
'', data_pair=data_pair, type_=ChartType.HEATMAP
).set_series_opts(
label_opts=opts.LabelOpts(is_show=False)
).set_global_opts(
title_opts=opts.TitleOpts(title='全国高校分布热力图', pos_left='650', pos_top='20',
title_textstyle_opts=opts.TextStyleOpts(color='white', font_size=16)),
visualmap_opts=opts.VisualMapOpts()
).render('high_school_heatmap.html')
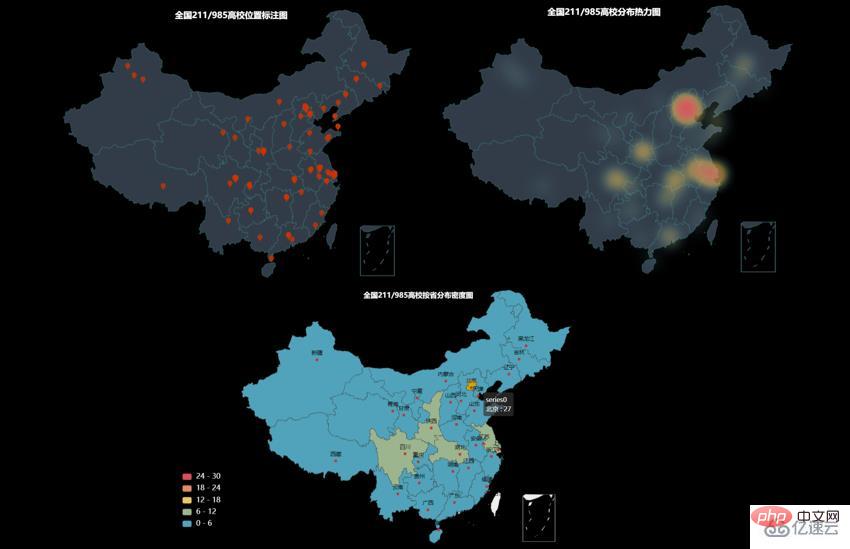
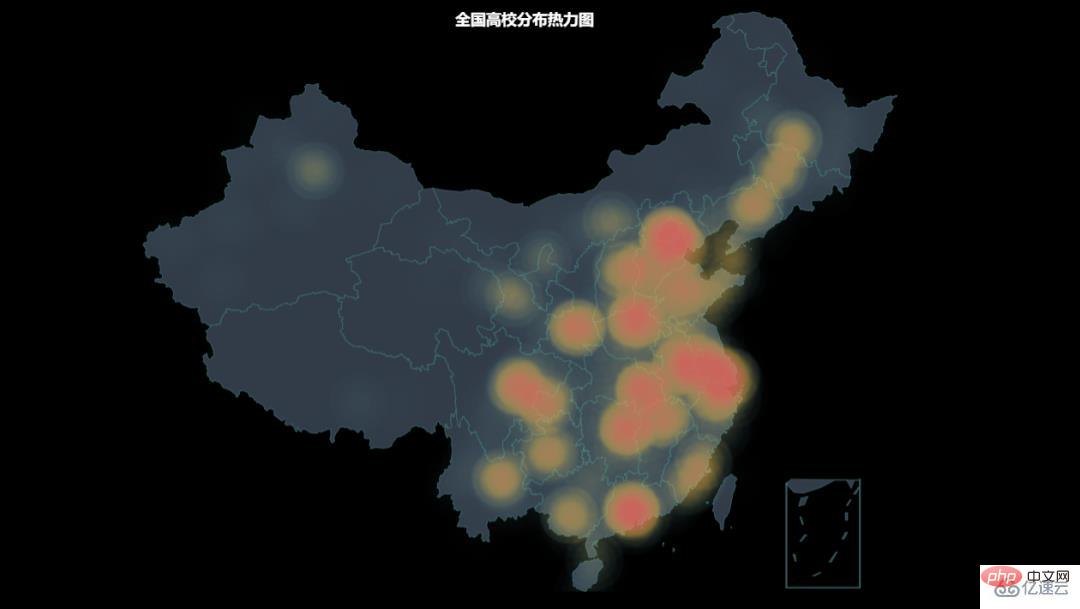 ## From the heat map, the places where colleges and universities are more concentrated are mainly coastal areas, The north, Shanghai, Guangzhou, Yangtze and Yellow River basins, and the more western areas are only Sichuan and Chongqing.
3.绘制按省划分的分布密度图
from pyecharts.charts import Map
from pyecharts import options as opts
import pandas as pd


def draw_location_density_map():
"""绘制各省高校分布密度图"""
map = Map(init_opts=opts.InitOpts(bg_color='black', width='1200px', height='700px'))
df = pd.read_excel('school_lng_lat.xlsx')
s = df['province_name'].value_counts()
data_pair = [[province, int(s[province])] for province in s.index]
map.add(
'', data_pair=data_pair, maptype="china"
).set_global_opts(
title_opts=opts.TitleOpts(title='全国高校按省分布密度图', pos_left='500', pos_top='70',
title_textstyle_opts=opts.TextStyleOpts(color='white', font_size=16)),
visualmap_opts=opts.VisualMapOpts(max_=200, is_piecewise=True, pos_left='100', pos_bottom='100',textstyle_opts=opts.TextStyleOpts(color='white', font_size=16))
).render("high_school_density.html")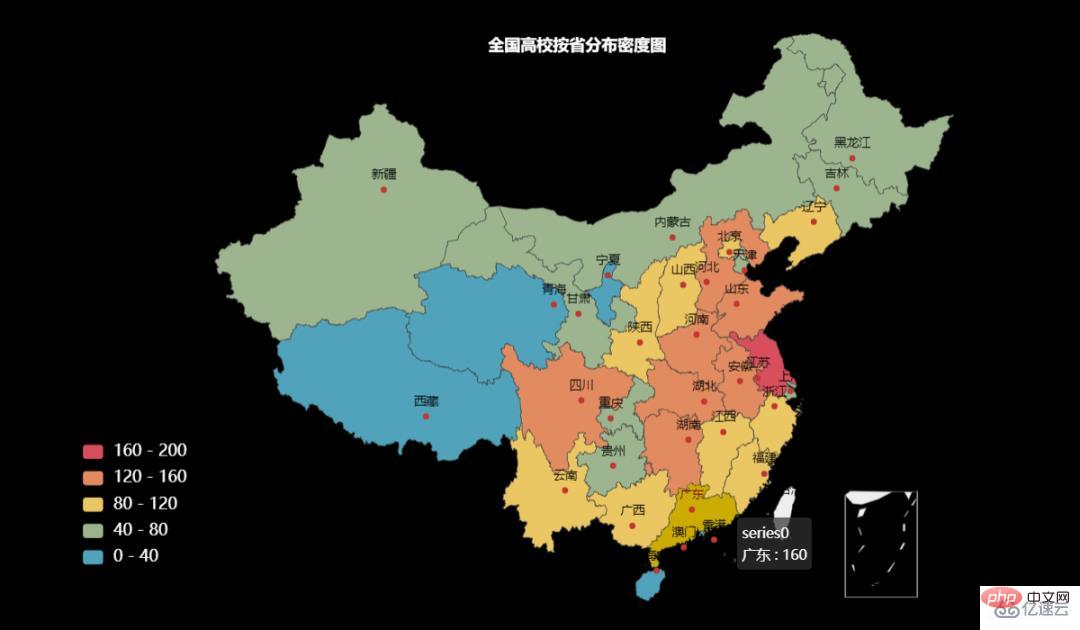
从省级分布密度图可以看出,高校数量多的省份集中在中部和东部,尤其是北京和上海附近的几个省。
4.211和985高校的分布情况
筛选出211和985的高校数据,再绘制一次。(代码不重复粘贴,只需要加一行筛选代码即可)
The above is the detailed content of How to use Python to display the distribution of colleges and universities across the country. For more information, please follow other related articles on the PHP Chinese website!


![[Web front-end] Node.js quick start](https://img.php.cn/upload/course/000/000/067/662b5d34ba7c0227.png)


