


Sparklines are miniature charts that represent data in Excel worksheet cells. Sparklines can be used to display data change trends very intuitively, highlighting maximum and minimum values. Placing them in a data table can achieve a good data analysis effect. This article will introduce how to create spark charts in Excel through Java code examples, as well as edit and delete spark charts in the table.
Program running environment: Java, IDEA, jdk1.8.0, no need to install Microsoft Excel
Use class library: Free Spire.XLS for Java (Free version)
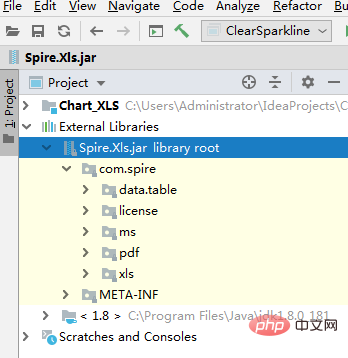
Class library acquisition and import: Download the jar package from the official website, unzip it, and import the jar file in the lib folder into the java program. Or you can download it from the maven repository and import it into the Maven project. The following import effect:
import com.spire.xls.*;

import java.awt.*;

public class CreateSparklineChart {
    public static void main(String[] args) {
        //创建一个Workbook类对象并加载Excel文档
        Workbook workbook = new Workbook();
        workbook.loadFromFile(  "test.xlsx");

        //获取第一个工作表
        Worksheet sheet = workbook.getWorksheets().get(0);

        //添加折线迷你图,设置折折线迷你图格式
        SparklineGroup sparklineGroup1 = sheet.getSparklineGroups().addGroup();
        sparklineGroup1.setSparklineType(SparklineType.Line);
        sparklineGroup1.setSparklineColor(new Color(153,50,204));
        sparklineGroup1.setShowHighPoint(true);
        //设置添加折现迷你图表的单元格以及图表生成的数据范围
        SparklineCollection sparklines1 = sparklineGroup1.add();
        sparklines1.add(sheet.getCellRange("B3:F3"), sheet.getCellRange("G3"));

        //添加柱形迷你图,并设置图表颜色
        SparklineGroup sparklineGroup2 = sheet.getSparklineGroups().addGroup();
        sparklineGroup2.setSparklineType(SparklineType.Column);
        sparklineGroup2.setSparklineColor(new Color(244,164,96));
        sparklineGroup2.setShowHighPoint(true);
        //设置添加柱形迷你图表的单元格以及图表生成的数据范围
        SparklineCollection sparklines2 = sparklineGroup2.add();
        sparklines2.add(sheet.getCellRange("B4:F4"), sheet.getCellRange("G4"));

        //添加盈亏迷你图,并设置颜色
        SparklineGroup sparklineGroup3 = sheet.getSparklineGroups().addGroup();
        sparklineGroup3.setSparklineType(SparklineType.Stacked);
        sparklineGroup3.setSparklineColor(new Color(255,20,147));
        sparklineGroup3.setShowHighPoint(true);
        //设置盈亏迷你图表的单元格以及图表生成的数据范围
        SparklineCollection sparklines3 = sparklineGroup3.add();
        sparklines3.add(sheet.getCellRange("B5:F5"), sheet.getCellRange("G5"));

        //保存文档
        workbook.saveToFile("AddSparkline.xlsx", ExcelVersion.Version2013);
        workbook.dispose();
    }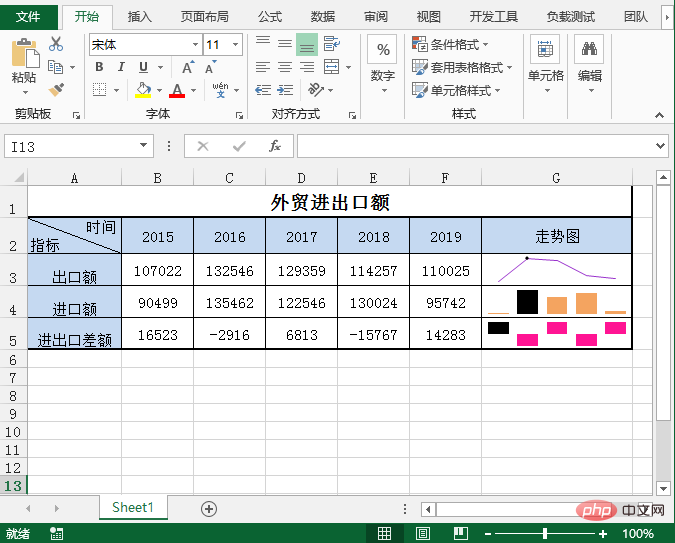
}Mini chart creation effect:
import com.spire.xls.*;
import com.spire.xls.core.spreadsheet.ISparklineGroup;
import com.spire.xls.core.spreadsheet.ISparklines;

public class ModifySparkline {
    public static void main(String[] args) {
        //创建实例,加载文档
        Workbook wb = new Workbook();
        wb.loadFromFile("AddSparkline.xlsx");

        //获取工作表
        Worksheet sheet = wb.getWorksheets().get(0);

        //修改第2个迷你图组中迷你图表类型和数据范围
        ISparklineGroup sparklineGroup = sheet.getSparklineGroups().get(1);
        sparklineGroup.setSparklineType(SparklineType.Line);
        ISparklines sparklines = sparklineGroup.get(1);
        sparklines.refreshRanges(sheet.getCellRange("C4:F4"), sheet.getCellRange("G4"));

        //保存文档
        wb.saveToFile("ModifySparkline.xlsx", ExcelVersion.Version2013);
        wb.dispose();
    }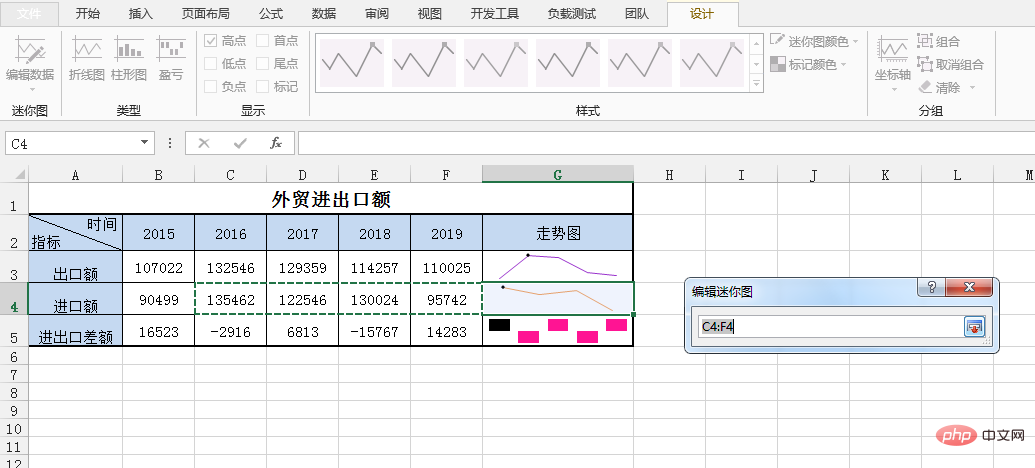
}Mini chart modification result:
import com.spire.xls.*;
import com.spire.xls.core.spreadsheet.ISparklineGroup;


public class ClearSparkline {
    public static void main(String[] args) {
        //创建实例,加载文档
        Workbook wb = new Workbook();
        wb.loadFromFile("AddSparkline.xlsx");

        //获取工作表
        Worksheet sheet = wb.getWorksheets().get(0);

        //获取第3个迷你图
        ISparklineGroup sparklineGroup = sheet.getSparklineGroups().get(2);

        //从工作表中删除图表
        sheet.getSparklineGroups().clear((SparklineGroup) sparklineGroup);

        wb.saveToFile("ClearSparkline.xlsx",ExcelVersion.Version2013);
        wb.dispose();
    }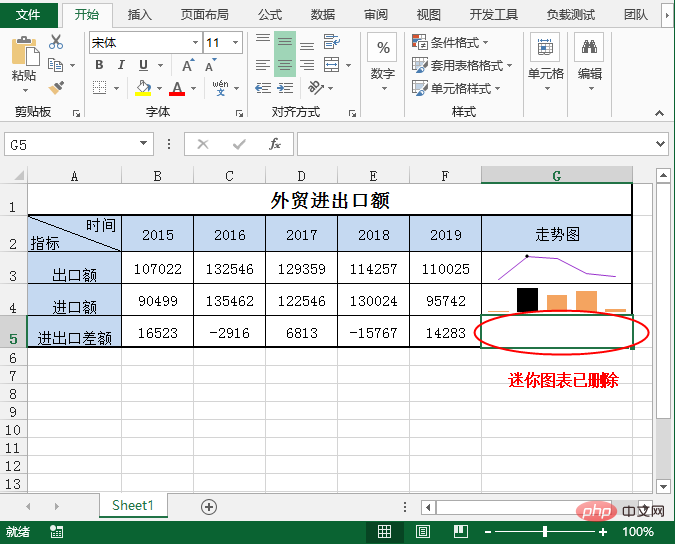
}Mini chart deletion effect:
The above is the detailed content of How to create, edit and delete Excel mini charts in Java. For more information, please follow other related articles on the PHP Chinese website!
 java
java
 java regular expression syntax
 Compare the similarities and differences between two columns of data in excel
 excel duplicate item filter color
 Is it difficult to learn Java by yourself?
 java configure jdk environment variables
 How to copy an Excel table to make it the same size as the original
 Java retains two decimal places


![[Web front-end] Node.js quick start](https://img.php.cn/upload/course/000/000/067/662b5d34ba7c0227.png)


