


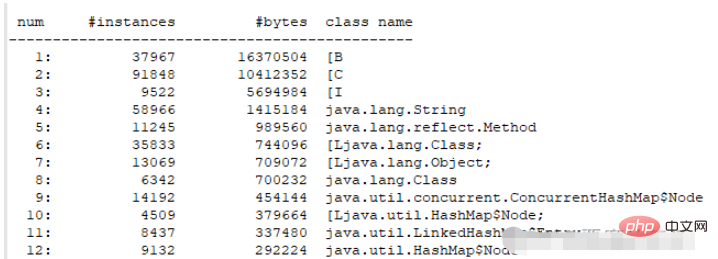
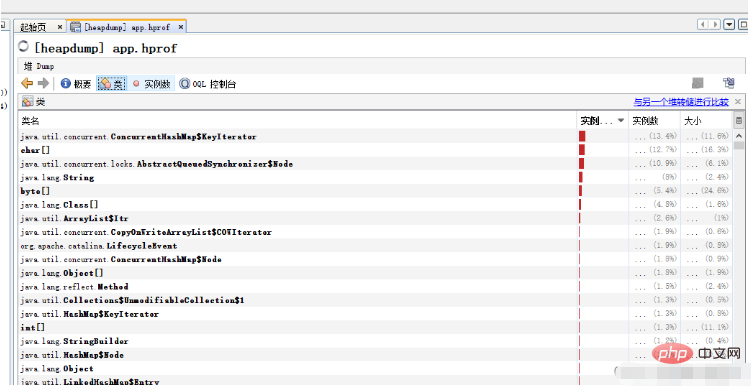
jmap histo /pid > ./log.txt: View the number of instances of a process, the number of bytes of memory occupied, and the class it belongs to
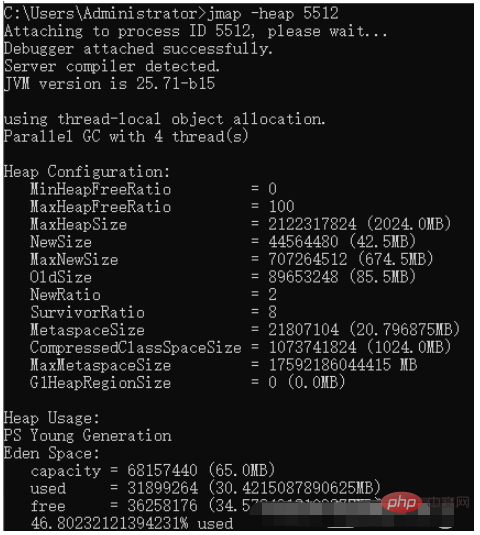
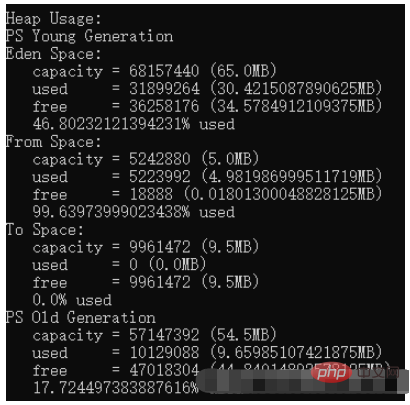
jmap -heap /pid: View heap information

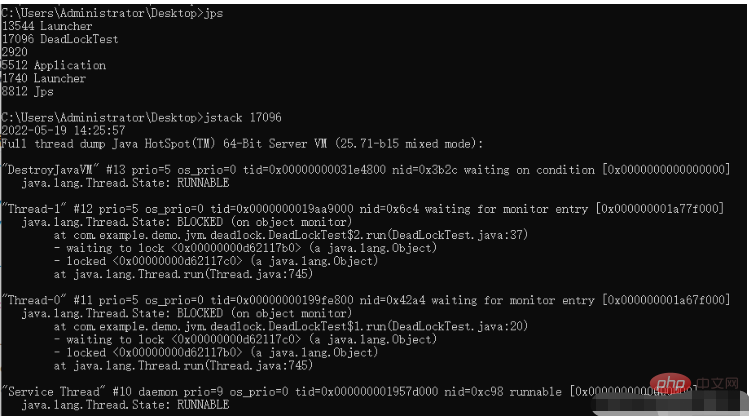
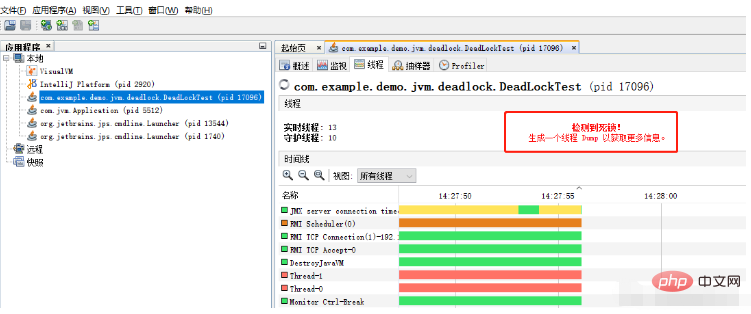
public class DeadLockTest {
    private final static Object lock1 = new Object();
    private final static Object lock2 = new Object();
    public static void main(String[] args) {
        new Thread(new Runnable() {
            @Override
            public void run() {
                synchronized (lock1) {
                    try {
                        System.out.println(Thread.currentThread().getName() + ": get the lock1");
                        Thread.sleep(2000);
                    } catch (InterruptedException e) {
                        e.printStackTrace();
                    }
                    synchronized (lock2) {
                        System.out.println(Thread.currentThread().getName() + ": get the lock2");
                    }
                }
            }
        }).start();
        new Thread(new Runnable() {
            @Override
            public void run() {
                synchronized (lock2) {
                    try {
                        System.out.println(Thread.currentThread().getName() + ": get the lock2");
                        Thread.sleep(2000);
                    } catch (InterruptedException e) {
                        e.printStackTrace();
                    }
                    synchronized (lock1) {
                        System.out.println(Thread.currentThread().getName() + ": get the lock1");
                    }
                }
            }
        }).start();
    }
}
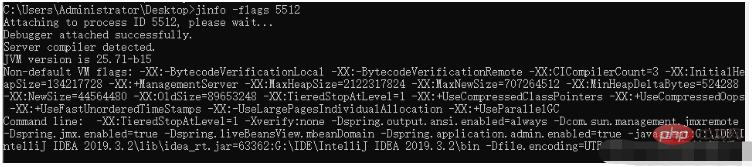
 ##jinfo View jvm system parameters
 jinfo -sysprops /pid: View the system parameters of java
##Jstat View the amount of heap memory usage and class loading information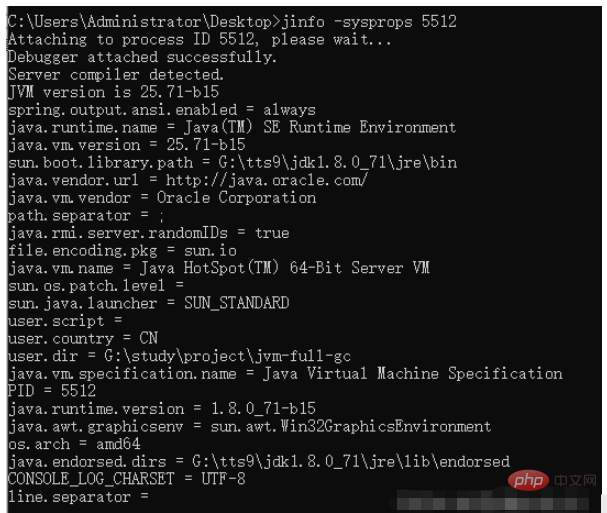
S0C: The size of the first survivor area, in KB; S1C: The size of the second survivor area; S0U: The used size of the first survivor area; S1U: the used size of the second survivor area; EC: the size of the Eden Garden; EU: the used size of the Eden Garden; OC: the old generation size; OU: the used size of the old generation; MC: Method area size (metaspace); MU: method area usage size; CCSC: compressed class space size; CCSU: compressed class space usage size; YGC: number of young generation garbage collections; YGCT: young generation garbage collection consumption time, unit s; FGC: Number of old generation garbage collections; FGCT: Old generation garbage collection time consumption, unit s; GCT: Total garbage collection time consumption, unit s
NGCMN: the minimum capacity of the new generation; NGCMX: the maximum capacity of the new generation; NGC: the current capacity of the new generation; S0C: the size of the first survivor area; S1C: the size of the second survivor area; EC: the size of Eden Garden; OGCMN: the minimum capacity of the old generation; OGCMX: the maximum capacity of the old generation; OGC: the current old generation size; OC: the current old generation size; MCMN: the minimum metadata capacity; MCMX: the maximum metadata capacity; MC : Current metadata space size; CCSMN: Minimum compression class space size; CCSMX: Maximum compression class space size; CCSC: Current compression class space size; YGC: Number of young generation GCs; FGC: Number of old generation GCs
TT: The number of times an object survives in the new generation; MTT: The maximum number of times an object survives in the new generation; DSS: Expected survivor area size
S0CMX: Maximum survivor area size 1; S1CMX: Maximum survivor area 2 Zone size; ECMX: Maximum Eden Zone size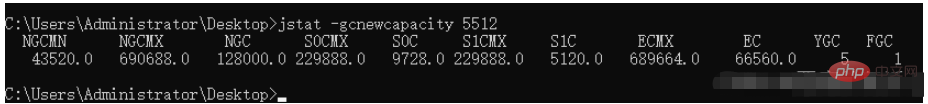


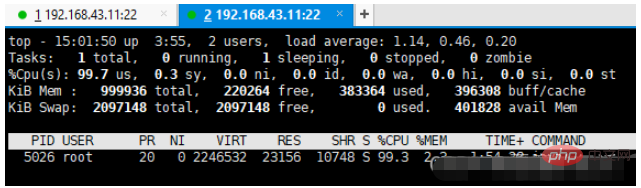
You can optimize the startup parameters of java applications through the jstat gc -pid command. jstat -gc pid 1000 10 (execute the command every 1 second, 10 times in total) to estimate how many new objects will be added to the Eden area per second. The time can be adjusted based on specific results. In fact, the optimization idea is simply to try to make the surviving objects after each Young GC less than 50% of the Survivor area, and keep them in the young generation. Try not to let the object enter the old age. Try to reduce the frequency of Full GC as much as possible to avoid the impact of frequent Full GC on JVM performance.
For some old data, such as jvm-level memory is not cleaned up in time, resulting in more and more data being piled up. Over time, full gc will be frequently caused, thus causing memory loss. leakage. You can use the mature cache architecture ehcache, which has implemented LRU data elimination strategy.
The above is the detailed content of Java JVM virtual machine tuning methods. For more information, please follow other related articles on the PHP Chinese website!


![[Web front-end] Node.js quick start](https://img.php.cn/upload/course/000/000/067/662b5d34ba7c0227.png)


