


Sviewgui is a PyQt-based GUI for data visualization of csv files or Pandas DataFrames. This GUI is based on matplotlib and you can visualize your csv files in many ways. Main features:
Project address: https://github.com/SojiroFukuda/sview-gui
This package is super simple to use. It has only one method: buildGUI(). This method can be passed zero or one parameter. You can use the file path of the csv file as an argument, or use a DataFrame object from pandas as an argument. Similar code is written as follows:
# 第一种形式 import sviewgui.sview as sv sv.buildGUI() # 第二种形式 import sviewgui.sview as sv FILE_PATH = "User/Documents/yourdata.csv" sv.buildGUI(FILE_PATH) # 第三种形式 import sviewgui.sview as sv import pandas as pd FILE_PATH = "User/Documents/yourdata.csv" df = pd.read_csv(FILE_PATH) sv.buildGUI(df)
The above code only helps the driver to open this GuI visual interface.
Finally, since this library is based on matplotlib visualization, the seaborn style also applies here, because seaborn is also based on matplotlib visualization.
This library has quite a few dependent libraries, so you can directly use the following line of code to install the sviewgui library.
pip install sviewgui -i https://pypi.tuna.tsinghua.edu.cn/simple/ --ignore-installed
I didn’t add the last --ignore-installed at first, but an error was reported. The error is roughly as follows:
ERROR: Cannot uninstall 'certifi'. It is a distutils installed project and thus we cannot accurately determine which files belong to it which would lead to only a partial uninstall.
Just add this, don’t worry about why, because I also have no idea!
I introduced 3 codes for opening the GUI graphical interface window above. Here I only introduce the following method:
import sviewgui.sview as sv sv.buildGUI()
The screenshot is as follows:
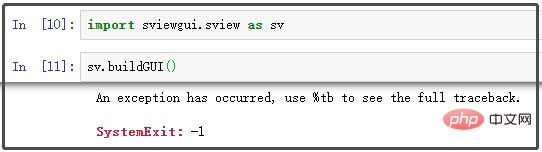
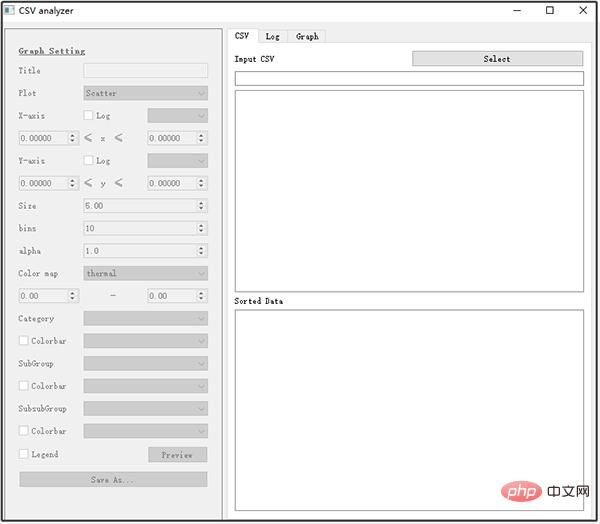
When you enter the above code on the command line, it will drive the graphical interface window to open in the background. The initialization state is roughly like this:
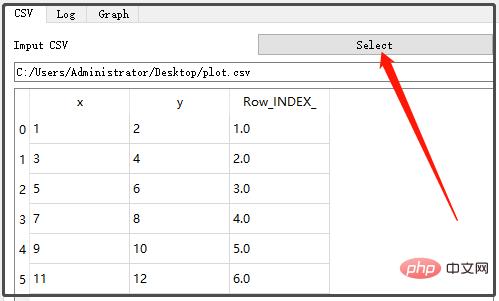
Click on the above select to select the data source:
Then we can click on the left menu bar to generate the corresponding graph. But there is one thing, it seems that it does not support Chinese! ! !
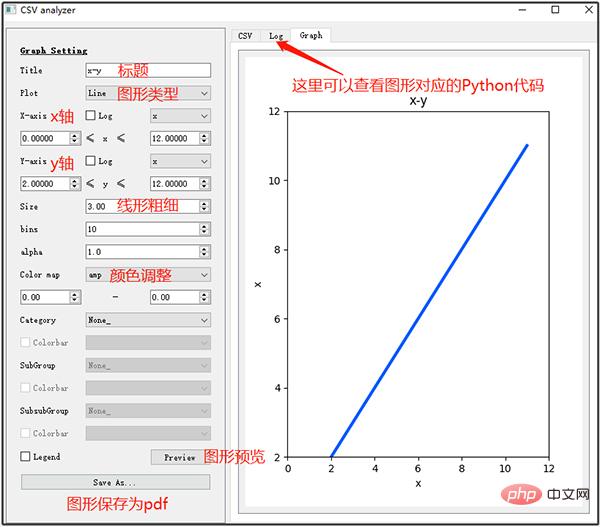
#If you feel that this is not enough to perfect the graphics you want, you can copy the Python code corresponding to the graphics and simply modify it.
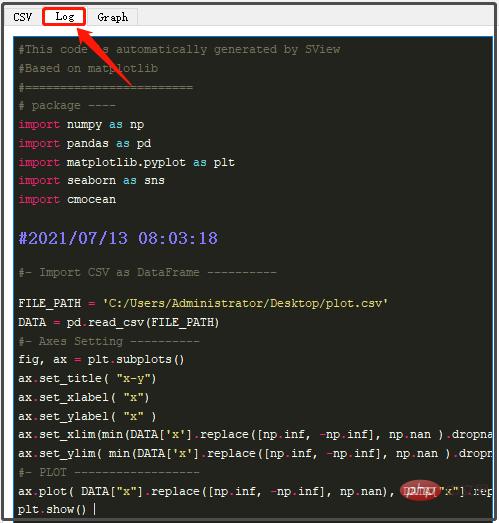
Then, you can take the following code and simply modify it to generate beautiful Matplotlib graphics.
import numpy as np import pandas as pd import matplotlib.pyplot as plt import seaborn as sns import cmocean #2021/07/13 08:03:18 #- Import CSV as DataFrame ---------- FILE_PATH = 'C:/Users/Administrator/Desktop/plot.csv' DATA = pd.read_csv(FILE_PATH) #- Axes Setting ---------- fig, ax = plt.subplots() ax.set_title( "x-y") ax.set_xlabel( "x") ax.set_ylabel( "x" ) ax.set_xlim(min(DATA['x'].replace([np.inf, -np.inf], np.nan ).dropna() ) - abs( min(DATA['x'].replace([np.inf, -np.inf], np.nan ).dropna() )/10), max(DATA['x'].replace([np.inf, -np.inf], np.nan).dropna()) + abs(max(DATA['x'].replace([np.inf, -np.inf], np.nan).dropna())/10)) ax.set_ylim( min(DATA['x'].replace([np.inf, -np.inf], np.nan ).dropna() ) - abs( min(DATA['x'].replace([np.inf, -np.inf], np.nan ).dropna() )/10), max(DATA['x'].replace([np.inf, -np.inf], np.nan).dropna()) + abs(max(DATA['x'].replace([np.inf, -np.inf], np.nan).dropna())/10)) #- PLOT ------------------ ax.plot( DATA["x"].replace([np.inf, -np.inf], np.nan), DATA["x"].replace([np.inf, -np.inf], np.nan), linewidth = 3.0, alpha =1.0, color = "#005AFF" ) plt.show()
The above is the detailed content of Another Python artifact, you can call Matplotlib for drawing without writing a line of code!. For more information, please follow other related articles on the PHP Chinese website!


![[Web front-end] Node.js quick start](https://img.php.cn/upload/course/000/000/067/662b5d34ba7c0227.png)


