

Too many features will increase model complexity and overfitting, while too few features will result in underfitting of the model. Optimizing a model to be complex enough so that its performance is generalizable, but simple enough to be easy to train, maintain, and interpret is the main task of feature selection.
"Feature selection" means that some features can be retained and some others discarded. The purpose of this article is to outline some feature selection strategies:
The data set for this demonstration is under the MIT license Released from PyCaret - an open source low-code machine learning library.
The data set is pretty clean, but I did some preprocessing. Note that I am using this dataset to demonstrate how different feature selection strategies work, not to build the final model, so model performance is irrelevant.
First load the dataset:
import pandas as pddata = 'https://raw.githubusercontent.com/pycaret/pycaret/master/datasets/automobile.csv'
df = pd.read_csv(data)
df.sample(5)

The dataset contains 202 rows and 26 columns - each row represents a car instance and each column represents its characteristics and corresponding prices. The columns include:
df.columns
>> Index(['symboling', 'normalized-losses', 'make', 'fuel-type', 'aspiration', 'num-of-doors', 'body-style', 'drive-wheels', 'engine-location','wheel-base', 'length', 'width', 'height', 'curb-weight', 'engine-type', 'num-of-cylinders', 'engine-size', 'fuel-system', 'bore', 'stroke', 'compression-ratio', 'horsepower', 'peak-rpm', 'city-mpg', 'highway-mpg', 'price'], dtype='object')
Now let’s delve into the 11 strategies for feature selection.
Of course, the easiest strategy is your intuition. Although intuitive, but sometimes useful, some columns will not be used in any form in the final model (e.g. "ID", "FirstName", "LastName", etc. columns). If you know a particular column won't be used, feel free to remove it. In our data, none of the columns have this problem so, I am not deleting any columns in this step.
Missing values are unacceptable in machine learning, so we use different strategies to clean missing data (such as imputation). But if a column is missing a lot of data, it's very good to remove it completely.
# total null values per column
df.isnull().sum()
>>
symboling 0
normalized-losses 35
make 0
fuel-type 0
aspiration 0
num-of-doors 2
body-style 0
drive-wheels 0
engine-location 0
wheel-base 0
length 0
width 0
height 0
curb-weight 0
engine-type 0
num-of-cylinders 0
engine-size 0
fuel-system 0
bore 0
stroke 0
compression-ratio 0
horsepower 0
peak-rpm 0
city-mpg 0
highway-mpg 0
price 0
dtype: int64
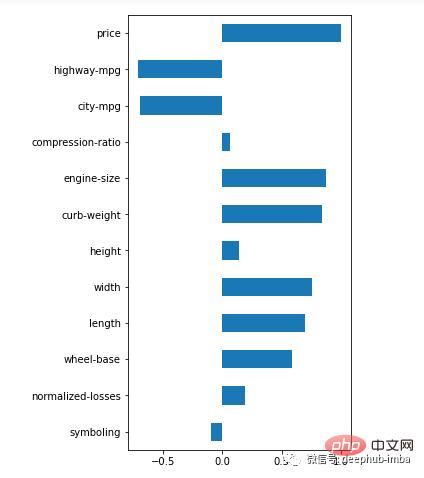
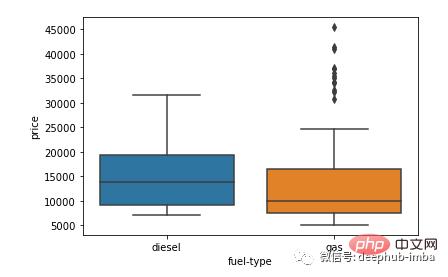
Whether the algorithm is regression (predicting numbers) or classification (predicting categories), features must be relevant to the target. If a feature shows no relevance, it is a prime target for elimination. Numerical and categorical features can be tested separately for correlation.
# correlation between target and features
(df.corr().loc['price'].plot(kind='barh', figsize=(4,10)))
# drop uncorrelated numeric features (threshold
corr = abs(df.corr().loc['price'])
corr = corr[corr0.2]
cols_to_drop = corr.index.to_list()
df = df.drop(cols_to_drop, axis=1)
import seaborn as sns
sns.boxplot(y = 'price', x = 'fuel-type', data=df)
import numpy as np
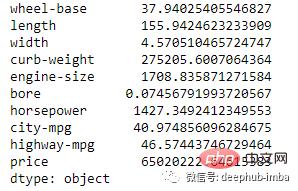
# variance of numeric features
(df.select_dtypes(include=np.number).var().astype('str'))
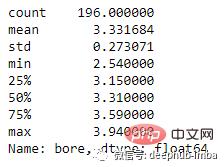
df['bore'].describe()
import matplotlib.pyplot as plt
sns.set(rc={'figure.figsize':(16,10)})
sns.heatmap(df.corr(),
annot=True,
linewidths=.5,
center=0,
cbar=False,
cmap="PiYG")
plt.show()
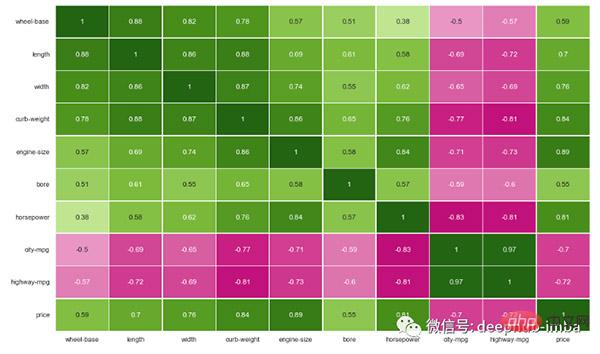
大多数特征在某种程度上相互关联,但有些特征具有非常高的相关性,例如长度与轴距以及发动机尺寸与马力。
可以根据相关阈值手动或以编程方式删除这些功能。我将手动删除具有 0.80 共线性阈值的特征。
# drop correlated features
df = df.drop(['length', 'width', 'curb-weight', 'engine-size', 'city-mpg'], axis=1)
还可以使用称为方差膨胀因子 (VIF) 的方法来确定多重共线性并根据高 VIF 值删除特征。我稍后会展示这个例子。
与数值特征类似,也可以检查分类变量之间的共线性。诸如独立性卡方检验之类的统计检验非常适合它。
让我们检查一下数据集中的两个分类列——燃料类型和车身风格——是独立的还是相关的。
df_cat = df[['fuel-type', 'body-style']]
df_cat.sample(5)
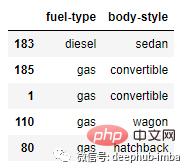
然后我们将在每一列中创建一个类别的交叉表/列联表。
crosstab = pd.crosstab(df_cat['fuel-type'], df_cat['body-style'])
crosstab

最后,我们将在交叉表上运行卡方检验,这将告诉我们这两个特征是否独立。
from scipy.stats import chi2_contingency
chi2_contingency(crosstab)

输出依次是卡方值、p 值、自由度和预期频率数组。
p 值
由于这两个特征之间存在关联,我们可以选择删除其中一个。
到目前为止,我已经展示了在实现模型之前应用的特征选择策略。这些策略在第一轮特征选择以建立初始模型时很有用。但是一旦构建了模型,就可以获得有关模型性能中每个特征的适应度的更多信息。根据这些新信息,可以进一步确定要保留哪些功能。
下面我们使用最简单的线性模型展示其中的一些方法。
# drop columns with missing values
df = df.dropna()
from sklearn.model_selection import train_test_split
# get dummies for categorical features
df = pd.get_dummies(df, drop_first=True)
# X features
X = df.drop('price', axis=1)
# y target
y = df['price']
# split data into training and testing set
X_train, X_test, y_train, y_test = train_test_split(X, y, test_size=0.3, random_state=42)
from sklearn.linear_model import LinearRegression
# scaling
from sklearn.preprocessing import StandardScaler
scaler = StandardScaler()
X_train = scaler.fit_transform(X_train)
X_test = scaler.fit_transform(X_test)
# convert back to dataframe
X_train = pd.DataFrame(X_train, columns = X.columns.to_list())
X_test = pd.DataFrame(X_test, columns = X.columns.to_list())
# instantiate model
model = LinearRegression()# fit
model.fit(X_train, y_train)
现在我们已经拟合了模型,让我们进行另一轮特征选择。
如果正在运行回归任务,则特征适应度的一个关键指标是回归系数(所谓的 beta 系数),它显示了模型中特征的相对贡献。有了这些信息,可以删除贡献很小或没有贡献的功能。
# feature coefficients
coeffs = model.coef_
# visualizing coefficients
index = X_train.columns.tolist()
(pd.DataFrame(coeffs, index = index, columns = ['coeff']).sort_values(by = 'coeff')
.plot(kind='barh', figsize=(4,10)))
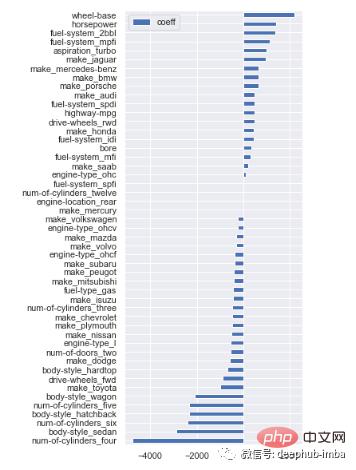
某些特征beta 系数很小,对汽车价格的预测贡献不大。可以过滤掉这些特征:
# filter variables near zero coefficient value
temp = pd.DataFrame(coeffs, index = index, columns = ['coeff']).sort_values(by = 'coeff')
temp = temp[(temp['coeff']>1) | (temp['coeff'] -1)]
# drop those features
cols_coeff = temp.index.to_list()
X_train = X_train[cols_coeff]
X_test = X_test[cols_coeff]
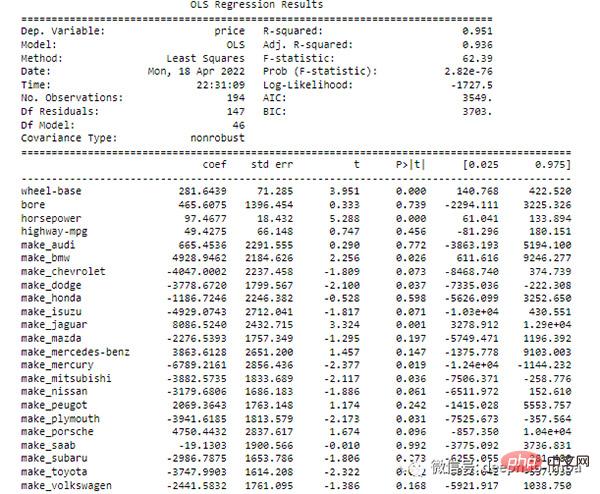
在回归中,p 值告诉我们预测变量和目标之间的关系是否具有统计显著性。statsmodels 库提供了带有特征系数和相关 p 值的回归输出的函数。
如果某些特征不显著,可以将它们一个一个移除,然后每次重新运行模型,直到找到一组具有显着 p 值的特征,并通过更高的调整 R2 提高性能。
import statsmodels.api as sm
ols = sm.OLS(y, X).fit()
print(ols.summary())
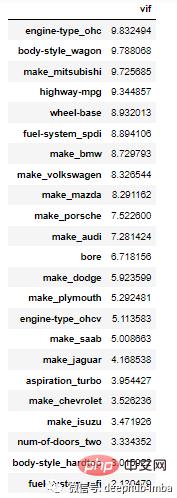
方差膨胀因子 (VIF) 是衡量多重共线性的另一种方法。它被测量为整体模型方差与每个独立特征的方差的比率。一个特征的高 VIF 表明它与一个或多个其他特征相关。根据经验:
VIF 是一种消除多重共线性特征的有用技术。对于我们的演示,将所有 VIF 高于10的删除。
from statsmodels.stats.outliers_influence import variance_inflation_factor
# calculate VIF
vif = pd.Series([variance_inflation_factor(X.values, i) for i in range(X.shape[1])], index=X.columns)
# display VIFs in a table
index = X_train.columns.tolist()
vif_df = pd.DataFrame(vif, index = index, columns = ['vif']).sort_values(by = 'vif', ascending=False)
vif_df[vif_df['vif']10]
决策树/随机森林使用一个特征来分割数据,该特征最大程度地减少了杂质(以基尼系数杂质或信息增益衡量)。找到最佳特征是算法如何在分类任务中工作的关键部分。我们可以通过 feature_importances_ 属性访问最好的特征。
让我们在我们的数据集上实现一个随机森林模型并过滤一些特征。
from sklearn.ensemble import RandomForestClassifier
# instantiate model
model = RandomForestClassifier(n_estimators=200, random_state=0)
# fit model
model.fit(X,y)
现在让我们看看特征重要性:
# feature importance
importances = model.feature_importances_
# visualization
cols = X.columns
(pd.DataFrame(importances, cols, columns = ['importance'])
.sort_values(by='importance', ascending=True)
.plot(kind='barh', figsize=(4,10)))
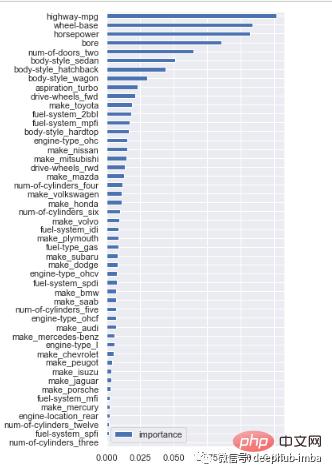
上面的输出显示了每个特征在减少每个节点/拆分处的重要性。
由于随机森林分类器有很多估计量(例如上面例子中的 200 棵决策树),可以用置信区间计算相对重要性的估计值。
# calculate standard deviation of feature importances
std = np.std([i.feature_importances_ for i in model.estimators_], axis=0)
# visualization
feat_with_importance = pd.Series(importances, X.columns)
fig, ax = plt.subplots(figsize=(12,5))
feat_with_importance.plot.bar(yerr=std, ax=ax)
ax.set_title("Feature importances")
ax.set_ylabel("Mean decrease in impurity")
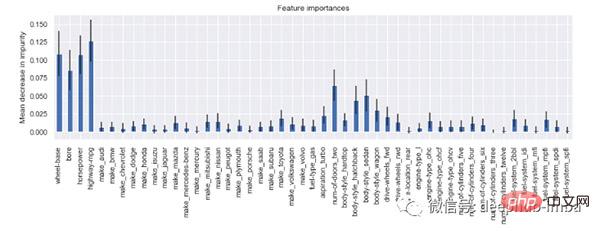
现在我们知道了每个特征的重要性,可以手动(或以编程方式)确定保留哪些特征以及删除哪些特征。
sklearn 库中有一个完整的模块,只需几行代码即可处理特征选择。
sklearn 中有许多自动化流程,但这里我只展示一些:
# import modules
from sklearn.feature_selection import (SelectKBest, chi2, SelectPercentile, SelectFromModel, SequentialFeatureSelector, SequentialFeatureSelector)
基于卡方的技术根据一些预定义的分数选择特定数量的用户定义特征 (k)。这些分数是通过计算 X(独立)和 y(因)变量之间的卡方统计量来确定的。在 sklearn 中,需要做的就是确定要保留多少特征。如果想保留 10 个功能,实现将如下所示:
# select K best features
X_best = SelectKBest(chi2, k=10).fit_transform(X,y)
# number of best features
X_best.shape[1]
>> 10
如果有大量特征,可以指定要保留的特征百分比。假设我们想要保留 75% 的特征并丢弃剩余的 25%:
# keep 75% top features
X_top = SelectPercentile(chi2, percentile = 75).fit_transform(X,y)
# number of best features
X_top.shape[1]
>> 36
正则化减少了过拟合。如果你有太多的特征,正则化控制它们的效果,或者通过缩小特征系数(称为 L2 正则化)或将一些特征系数设置为零(称为 L1 正则化)。
一些模型具有内置的 L1/L2 正则化作为超参数来惩罚特征。可以使用转换器 SelectFromModel 消除这些功能。
让我们实现一个带有惩罚 = 'l1' 的 LinearSVC 算法。然后使用 SelectFromModel 删除一些功能。
# implement algorithm
from sklearn.svm import LinearSVC
model = LinearSVC(penalty= 'l1', C = 0.002, dual=False)
model.fit(X,y)
# select features using the meta transformer
selector = SelectFromModel(estimator = model, prefit=True)
X_new = selector.transform(X)
X_new.shape[1]
>> 2
# names of selected features
feature_names = np.array(X.columns)
feature_names[selector.get_support()]
>> array(['wheel-base', 'horsepower'], dtype=object)
序贯法是一种经典的统计技术。在这种情况下一次添加/删除一个功能并检查模型性能,直到它针对需求进行优化。
序贯法有两种变体。前向选择技术从 0 特征开始,然后添加一个最大程度地减少错误的特征;然后添加另一个特征,依此类推。
向后选择在相反的方向上起作用。模型从包含的所有特征开始并计算误差;然后它消除了一个可以进一步减少误差的特征。重复该过程,直到保留所需数量的特征。
# instantiate model
model = RandomForestClassifier(n_estimators=100, random_state=0)
# select features
selector = SequentialFeatureSelector(estimator=model, n_features_to_select=10, direction='backward', cv=2)
selector.fit_transform(X,y)
# check names of features selected
feature_names = np.array(X.columns)
feature_names[selector.get_support()]
>> array(['bore', 'make_mitsubishi', 'make_nissan', 'make_saab',
'aspiration_turbo', 'num-of-doors_two', 'body style_hatchback', 'engine-type_ohc', 'num-of-cylinders_twelve', 'fuel-system_spdi'], dtype=object)
PCA的主要目的是降低高维特征空间的维数。原始特征被重新投影到新的维度(即主成分)。最终目标是找到最能解释数据方差的特征数量。
# import PCA module
from sklearn.decomposition import PCA
# scaling data
X_scaled = scaler.fit_transform(X)
# fit PCA to data
pca = PCA()
pca.fit(X_scaled)
evr = pca.explained_variance_ratio_
# visualizing the variance explained by each principal components
plt.figure(figsize=(12, 5))
plt.plot(range(0, len(evr)), evr.cumsum(), marker="o", linestyle="--")
plt.xlabel("Number of components")
plt.ylabel("Cumulative explained variance")
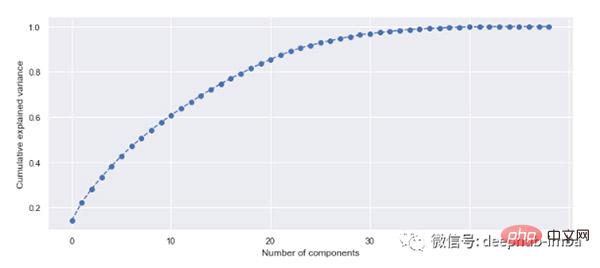
20 个主成分解释了超过 80% 的方差,因此可以将模型拟合到这 20 个成分(特征)。可以预先确定方差阈值并选择所需的主成分数量。
这是对可应用于特征选择的各种技术的有用指南。在拟合模型之前应用了一些技术,例如删除具有缺失值的列、不相关的列、具有多重共线性的列以及使用 PCA 进行降维,而在基本模型实现之后应用其他技术,例如特征系数、p 值、 VIF 等。虽然不会在一个项目中完全使用所有策略,这些策略都是我们进行测试的方向。
The above is the detailed content of Summary of 11 feature selection strategies for machine learning!. For more information, please follow other related articles on the PHP Chinese website!
 linux find
 Introduction to the usage of vbs whole code
 What are the core technologies necessary for Java development?
 What are the seven principles of PHP code specifications?
 How to use spyder
 What is the difference between php7 and php8
 nagios configuration method
 windows lock screen shortcut keys


