


This article brings you relevant knowledge about javascript, mainly introduces an in-depth understanding of JavaScript memory management and GC algorithm, mainly explains JavaScript's garbage collection mechanism and commonly used garbage collection algorithms; also This article explains the memory management in the V8 engine. I hope it will be helpful to everyone.

[Related recommendations: javascript video tutorial, web front-end】
JavaScript automatically allocates memory when creating variables (arrays, strings, objects, etc.), and will "automatically" release the allocated content when they are not used; the JavaScript language is not like other underlying languages The same language, such as C language, they provide memory management interfaces, such as malloc() is used to allocate the required memory space, free() releases the previously allocated memory space .
the process of releasing memory as garbage collection. High-level languages like JavaScript provide memory automatic allocation and automatic recycling. Because this automatically causes many developers not to care about memory management.
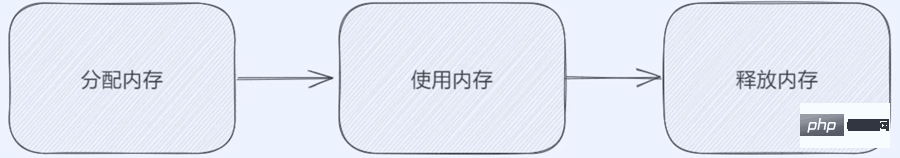
Even if high-level languages provide automatic memory management, we still need to have a basic understanding of internal management. Sometimes there is a problem with automatic memory management. We can solve it better, or use The least expensive way to solve it. Memory life cycleIn fact, no matter what language it is, the memory declaration cycle is roughly divided into the following stages:
Below we explain each step in detail:
In order to protect the developer's hair, JavaScript Memory allocation is automatically completed when defining variables. The sample code is as follows:
let num = 123 // 给数值变量分配内存
let str = '一碗周' // 给字符串分配内存

let obj = {
  name: '一碗周',
  age: 18,
} // 给对象及其包含的值分配内存

// 给数组及其包含的值分配内存(类似于对象)
let arr = [1, null, 'abc']

function fun(a) {
  return a + 2
} // 给函数(可调用的对象)分配内存

// 函数表达式也能分配一个对象
Element.addEventListener(
  'click',
  event => {
    console.log(event)
  },
  false,
)Sometimes the memory will not be reallocated, such as the following code:
// 给数组及其包含的值分配内存(类似于对象)
let arr = [1, null, 'abc']

let arr2 = [arr[0], arr[2]]
// 这里并不会重新对分配内存,而是直接存储原来的那份内存
Or when cannot be accessed from the root, it will be recycled as garbage. The reachable object in JavaScript is simply an object that
can be accessed, whether it is through a reference or a scope chain, as long as it can be accessed, it is called reachable object. There is a standard for the reachability of reachable objects, that is, whether they can be found starting from the root; the root here can be understood as the global variable object in JavaScript, which in the browser environment is window, in In the Node environment it is global.
let person = {
  name: '一碗周',
}
let man = person
person = null
Copy after login
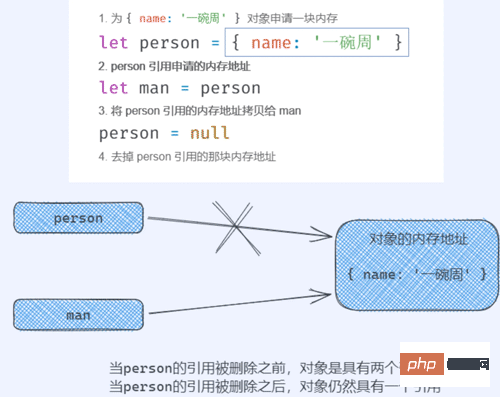 We can see from the picture above that in the end this
will not be recycled as garbage because it still has a reference .
调用 如下图: 现在来看下面这段代码: 我们删除 图解如下: 此时的 GC是Garbage collection的简写,也就是垃圾回收。当GC进行工作的时候,它可以找到内存中的垃圾、并释放和回收空间,回收之后方便我们后续的进行使用。 在GC中的垃圾包括程序中不在需要使用的对象以及程序中不能再访问到的对象都会被当做垃圾。 GC算法就是工作时查找和回收所遵循的规则,常见的GC算法有如下几种: 引用计数算法的核心思想就是设置一个引用计数器,判断当前引用数是否为0 ,从而决定当前对象是不是一个垃圾,从而垃圾回收机制开始工作,释放这块内存。 引用计数算法的核心就是引用计数器 ,由于引用计数器的存在,也就导致该算法与其他GC算法有所差别。 引用计数器的改变是在引用关系发生改变时就会发生变化,当引用计数器变为0的时候,该对象就会被当做垃圾回收。 现在我们通过一段代码来看一下: 引用计数算法的优点如下: 缺点如下: 就比如下面这段代码: 上面的代码中,当函数执行完成之后函数体的内容已经是没有作用的了,但是由于 标记清除算法解决了引用计数算法的⼀些问题, 并且实现较为简单, 在V8引擎中会有被⼤量的使⽤到。 在使⽤标记清除算法时,未引用对象并不会被立即回收.取⽽代之的做法是,垃圾对象将⼀直累计到内存耗尽为⽌.当内存耗尽时,程序将会被挂起,垃圾回收开始执行.当所有的未引用对象被清理完毕 时,程序才会继续执行.该算法的核心思想就是将整个垃圾回收操作分为标记和清除两个阶段完成。 第一个阶段就是遍历所有对象,标记所有的可达对象;第二个阶段就是遍历所有对象清除没有标记的对象,同时会抹掉所有已经标记的对象,便于下次的工作。 为了区分可用对象与垃圾对象,我们需要在每⼀个对象中记录对象的状态。 因此, 我们在每⼀个对象中加⼊了⼀个特殊的布尔类型的域, 叫做 进行垃圾回收完毕之后,将回收的内存放在空闲链表中方便我们后续使用。 标记清除算法最大的优点就是解决了引用计数算法无法回收循环引用的对象的问题 。就比如下面这段代码:function groupObj(obj1, obj2) {
obj1.next = obj2
obj2.prev = obj1
return {
obj1,
obj2,
}
}
let obj = groupObj({ name: '大明' }, { name: '小明' })Copy after logingroupObj()函数的的结果obj是一个包含两个对象的一个对象,其中obj.obj1的next属性指向obj.obj2;而obj.obj2的prev属性又指向obj.obj2。最终形成了一个无限套娃。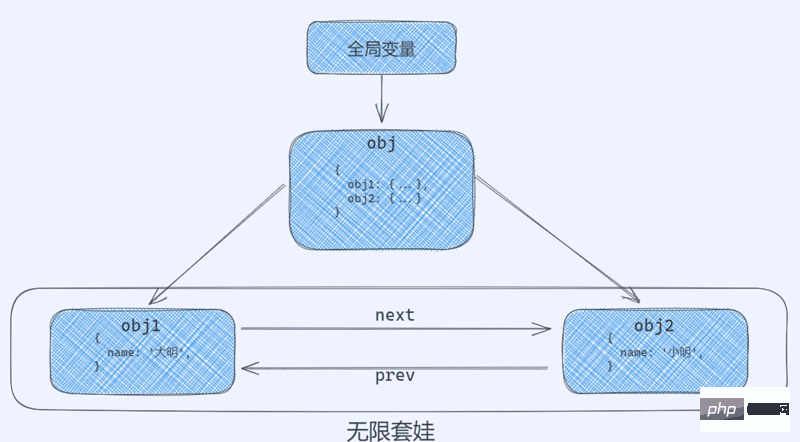
delete obj.obj1
delete obj.obj2.prev
Copy after loginobj对象中的obj1对象的引用和obj.obj2中的prev属性对obj1的引用。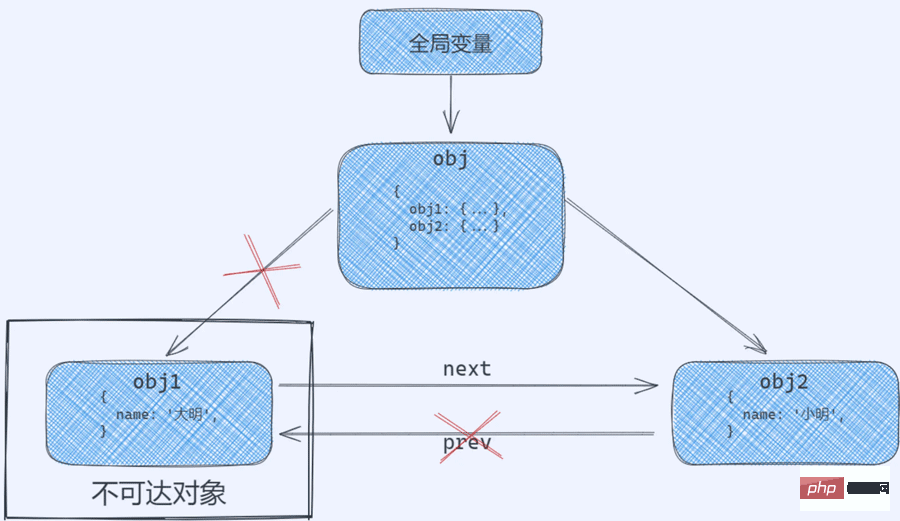
obj1就被当做垃圾给回收了。GC算法
引用计数算法
// { name: '一碗周' } 的引用计数器 + 1
let person = {
  name: '一碗周',
}
// 又增加了一个引用,引用计数器 + 1
let man = person
// 取消一个引用,引用计数器 - 1
person = null
// 取消一个引用,引用计数器 - 1。此时 { name: '一碗周' } 的内存就会被当做垃圾回收
man = null
Copy after loginfunction fun() {
const obj1 = {}
const obj2 = {}
obj1.next = obj2
obj2.prev = obj1
return '一碗周'
}
fun()Copy after loginobj1和obj2都存在不止1个引用,导致两种都无法被回收,就造成了空间内存的浪费。标记清除算法
marked。 默认情况下, 对象被创建时处于未标记状态。 所以, marked 域被初始化为false。function fun() {
const obj1 = {},
obj2 = {},
obj3 = {},
obj4 = {},
obj5 = {},
obj6 = {}
obj1.next = obj2
obj2.next = obj3
obj2.prev = obj6
obj4.next = obj6
obj4.prev = obj1
obj5.next = obj4
obj5.prev = obj6
return obj1
}
const obj = fun()Copy after login
当函数执行完毕后obj4的引用并不是0,但是使用引用计数算法并不能将其作为垃圾回收掉,而使用标记清除算法就解决了这个问题。
The mark and clear algorithm also has shortcomings. This algorithm will lead to memory fragmentation and discontinuous addresses. In addition, even if the mark and clear algorithm is used to find garbage objects, it cannot be cleared immediately, and it needs to be done a second time. Clear.
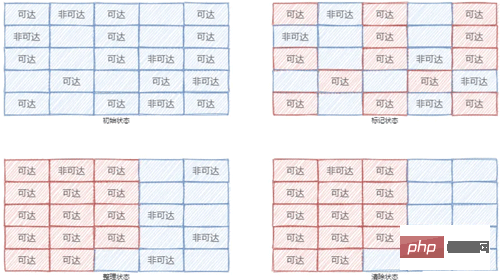
The marking and sorting algorithm can be regarded as an enhanced version of the mark and clear algorithm, and its steps are also divided into two stages: marking and clearing.
But the clearing phase of the mark sorting algorithm will sort out first, move the position of the object, and finally clear.
The steps are as follows:
V8 is a mainstream JavaScript execution engine. Node.js and most browsers now use V8 as the JavaScript engine. V8's compilation function uses just-in-time compilation, also known as dynamic translation or run-time compilation, which is a method of executing computer code that involves compiling during the execution of the program (during execution) rather than before execution. .
The V8 engine has an upper limit on memory. The upper limit is 1.5G under a 64-bit operating system, and the upper limit is 800 MB under a 32-bit operating system. As for why the memory upper limit is set, the main reason is that the content V8 engine is mainly prepared for browsers and is not suitable for large spaces; another point is that garbage collection of this size is very fast and the user has almost no feeling, thus increasing the user experience.
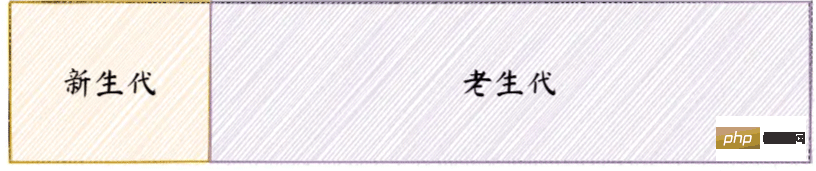
The V8 engine adopts the idea of generational recycling, which mainly divides our memory into two categories according to certain rules, one is the new generation storage area, and the other is It is the old generation storage area.
Objects in the new generation are objects with a short survival time. Simply put, they are newly generated objects. They usually only support a certain capacity (32 MB for 64-bit operating systems and 16 MB for 32-bit operating systems). Objects in the old generation are objects that have a long survival event or are resident in memory. Simply put, they are objects that have survived after the new generation garbage collection, and their capacity is usually relatively large.
The following figure shows the memory in V8:
The V8 engine will use different GCs based on different objects. Algorithm, the commonly used GC algorithm in V8 is as follows:
We also introduced above that the new generation stores objects with shorter survival times. The new generation object recycling process uses a copy algorithm and a mark sorting algorithm.
The copy algorithm divides our new generation memory area into two spaces of the same size. We call the currently used state space the From state, and the space state space is called the To state.
As shown in the figure below:
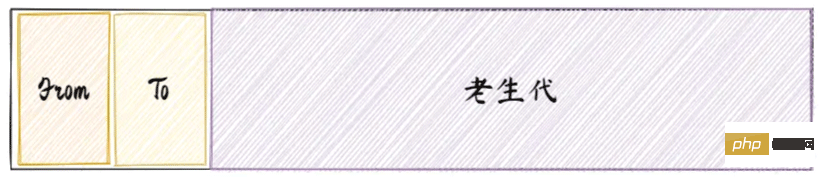
#We store all active objects in the From space. When the space is close to full, it will be triggered. Garbage collection.
Firstly, the active objects in the new generation From space need to be marked and organized. After the marking is completed, the marked active objects will be copied to the To space and the unmarked objects will be recycled; finally, the From space and To space for exchange.
Another thing that needs to be mentioned is that when copying objects, new generation objects will be moved to old generation objects.
These moved objects have specified conditions. There are two main types:
It can be seen that the garbage collection method for new generation objects is to exchange space for time.
The objects stored in the old generation area are objects that have a long survival time and occupy a large space. It is precisely because of its long survival time and large space occupation that the replication algorithm cannot be used. If the replication algorithm is used, it will cause long time and waste of space.
Old generation objects generally use mark clearing, mark sorting and incremental marking algorithms for garbage collection.
In the clearing phase, the mark clearing algorithm is mainly used for recycling. After a period of time, a large number of discontinuous memory fragments will be generated. When too many fragments cannot allocate enough memory, mark sorting will be used. Algorithms to defragment our space.
The garbage collection of old generation objects will use the incremental marking algorithm to optimize the garbage collection process. The incremental marking algorithm is shown in the figure below:
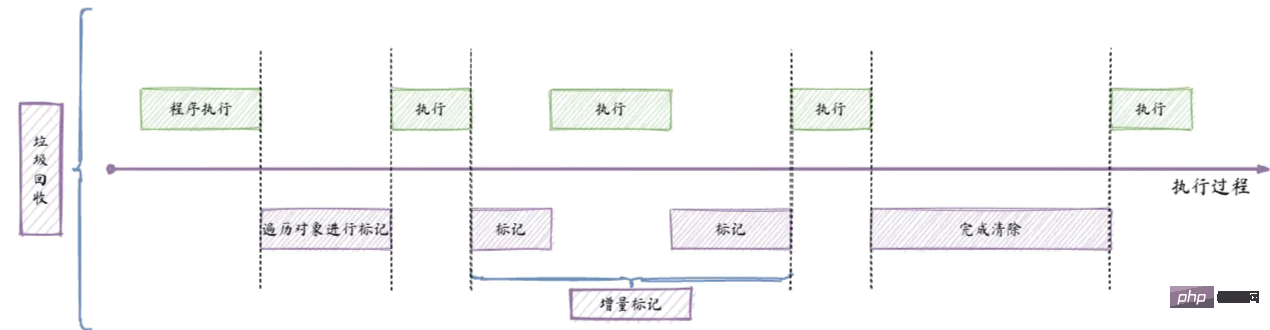
Since JavaScript is single-threaded, only one program execution and garbage collection can be run at the same time. This will cause the program to freeze when garbage collection is executed, which will definitely give the user a bad experience.
Therefore, incremental marking is proposed. When the program is running, the program first runs for a period of time, and then performs preliminary marking. This mark may only mark directly reachable objects, and then the program continues to run for a period of time. Incremental marking is being performed, that is, which indirectly reachable objects are marked. Repeat this until the end.
Since JavaScript does not provide us with an API to operate memory, we can only rely on the memory management provided by itself, but we do not know what the actual memory management is like. Sometimes we need to keep an eye on memory usage. The Performance tool provides a variety of ways to monitor memory.
First we open the Chrome browser (here we are using the Chrome browser, other browsers are also possible), enter our target address in the address bar, and then Open the developer tools and select the [Performance] panel.
Select the performance panel and turn on the recording function, then access the specific interface, imitate the user to perform some operations, and then stop recording. Finally, we can analyze the recorded memory information in the analysis interface.
Manifestations of memory problems
The main manifestations of memory problems are as follows:
Regarding this problem, we can analyze the reason through the memory change graph:
The problem causing memory expansion may be a problem with our code, or it may be that the device itself is poor. If we want to analyze, locate and solve it, we need to conduct repeated tests on multiple devices
To detect whether memory leaks, we can monitor our memory through Total Memory View. If the memory continues to increase, a memory leak may have occurred.
There are mainly the following ways to monitor memory in the browser:
Next we will explain this separately Several ways.
Press the [Shift] [ESC] key in the browser to open the task manager provided by the browser. The following figure shows the tasks in the Chrome browser Manager, let’s interpret it
In the picture above, we can see that the [Memory Occupied Space] of the [Nuggets] tab represents the memory occupied by the DOM of this page in the browser. If it continues Increasing means that a new DOM is being created; and the following [Memory used by JavaScript] (not enabled by default, needs to be opened by right-clicking) represents the heap in JavaScript, and the size in brackets represents all reachable objects in JavaScript .
The task manager provided in the browser described above can only be used to help us determine whether there is a problem with the page, but it cannot locate the problem with the page.
Timeline is a small tab in the Performance tool, which records the situation on the page in milliseconds, which can help us locate problems more easily.
Heap snapshot is a very targeted search for whether there are some separated DOMs in the current interface object. The existence of separated DOM means there is a memory leak.
First of all, we must first understand the several states of DOM:
Find the steps to detached DOM: Open the developer tools → [Memory Panel] → [User Configuration] → [Get Snapshot] → Enter Detached in [Filter]. Find the separated DOM,
as shown below:
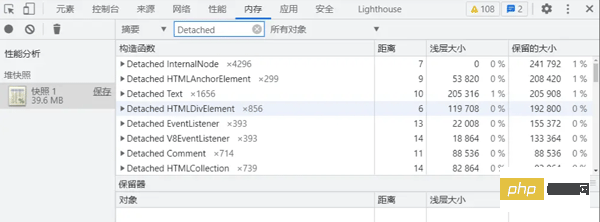
After finding the created separated DOM, we find the reference to the DOM and then release it.
Because the application is stopped when GC is working. If the current garbage collection is working frequently and the time is too long, the page will be damaged. It is said to be very unfriendly and will cause the application to appear to be in the "I" state. Users will perceive the application to be stuck during use.
We can judge whether there is frequent garbage collection in the following ways, as follows:
【Related recommendations: javascript video tutorial, web front-end】
The above is the detailed content of In-depth understanding of JavaScript memory management and GC algorithms. For more information, please follow other related articles on the PHP Chinese website!


![JavaScript core tutorial [DOM BOM operations that JS must know]](https://img.php.cn/upload/course/000/000/041/61c56ae28d02a390.jpg)
![JavaScript in-depth analysis [Web front-end must know basic skills]](https://img.php.cn/upload/course/000/000/041/61d3ff1c83b43350.jpg)


![[Web front-end] Node.js quick start](https://img.php.cn/upload/course/000/000/067/662b5d34ba7c0227.png)


