


This article brings you relevant knowledge about python, which mainly introduces some issues about the basics of data analysis, including reading other files, pivot tables, etc., as follows Let's take a look, I hope it will be helpful to everyone.

Recommended learning: python video tutorial
Continue Next, we read three types of files csvtsvtxt files. It is worth noting that the same method is used to read these three types of files, that is pd.read_csv(file), when reading an excel table, you need to pay attention to the separator and use the parameter sep='' to separate. Next, let’s take a look at how to operate it in excel and pandas!
Import external data from excel
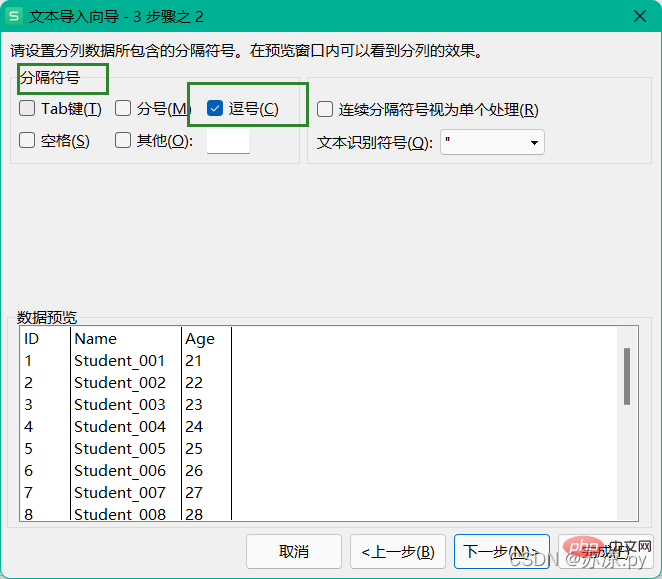
When importing a csv file, select comma as the separator.
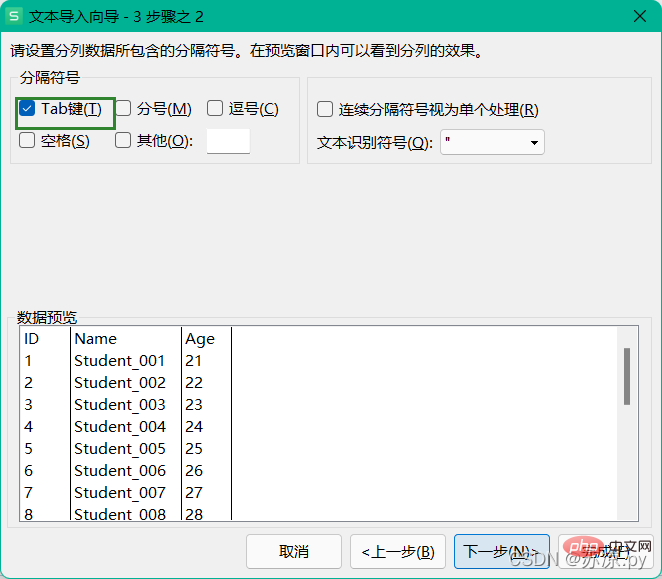
Import tsv file, select tab key as separator
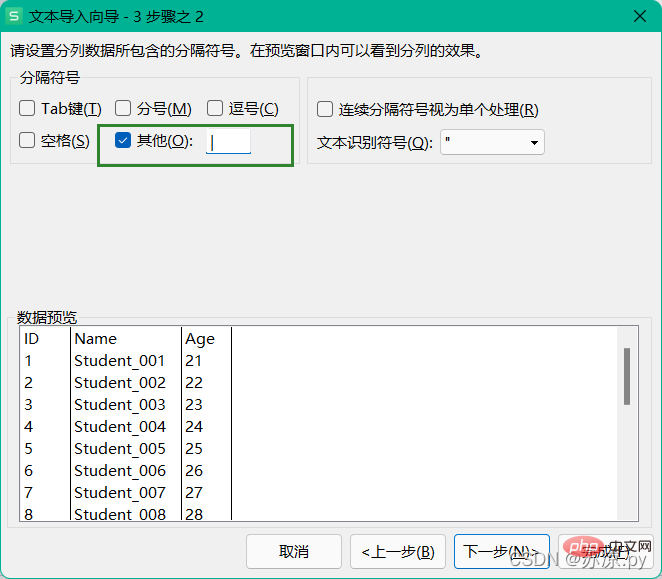
When importing txt file, pay attention to what symbols are used to separate the text and customize the delimiter.
In pandas, whether it is reading csv files, tsv files or txt Files are read using the read_csv() method, and separated by the sep() parameter.
import pandas as pd

# 导入csv文件
test1 = pd.read_csv('./excel/test12.csv',index_col="ID")
df1 = pd.DataFrame(test1)

print(df1)The tab key is represented by \t
import pandas as pd

# 导入tsv文件
test3 = pd.read_csv("./excel/test11.tsv",sep='\t')
df3 = pd.DataFrame(test3)

print(df3)import pandas as pd
# 导入txt文件
test2 = pd.read_csv("./excel/test13.txt",sep='|')
df2 = pd.DataFrame(test2)
print(df2) Result: 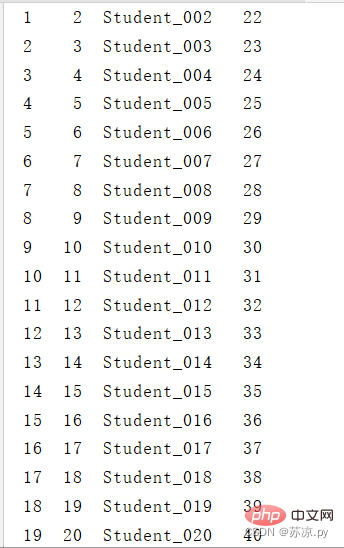
in There are many types of data in excel, and they are divided into many types. At this time, using a pivot table will be very convenient and intuitive to analyze the various data we want.
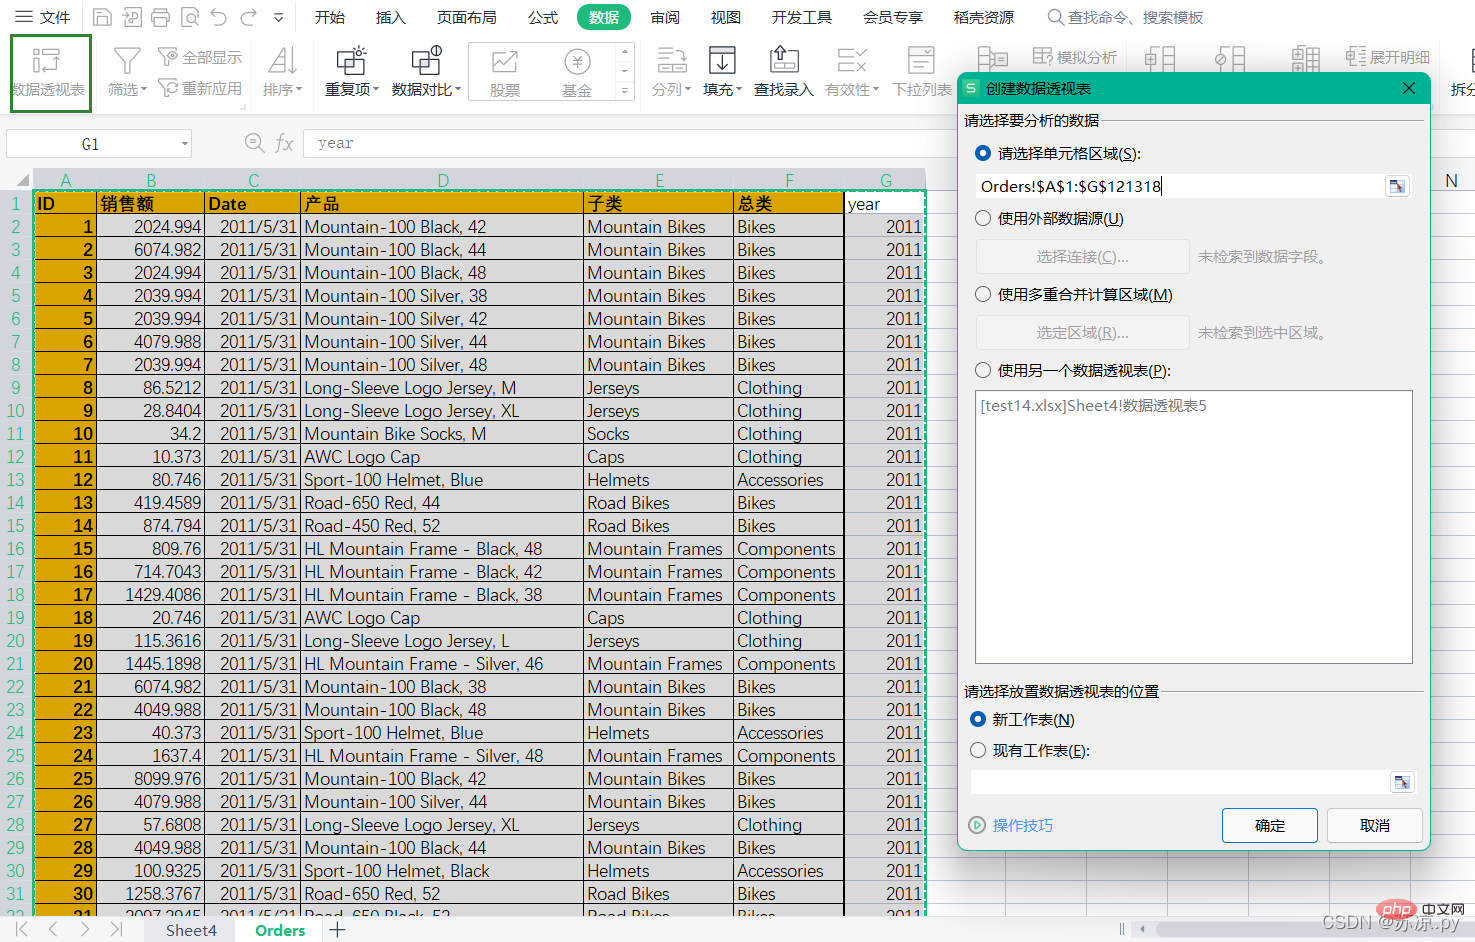
Example: Draw the following data into a pivot table, and draw the annual sales by general category!
needs to be divided by year, then we need to split the date column and the year separate it. Then select the PivotTable under the data column and select the area.
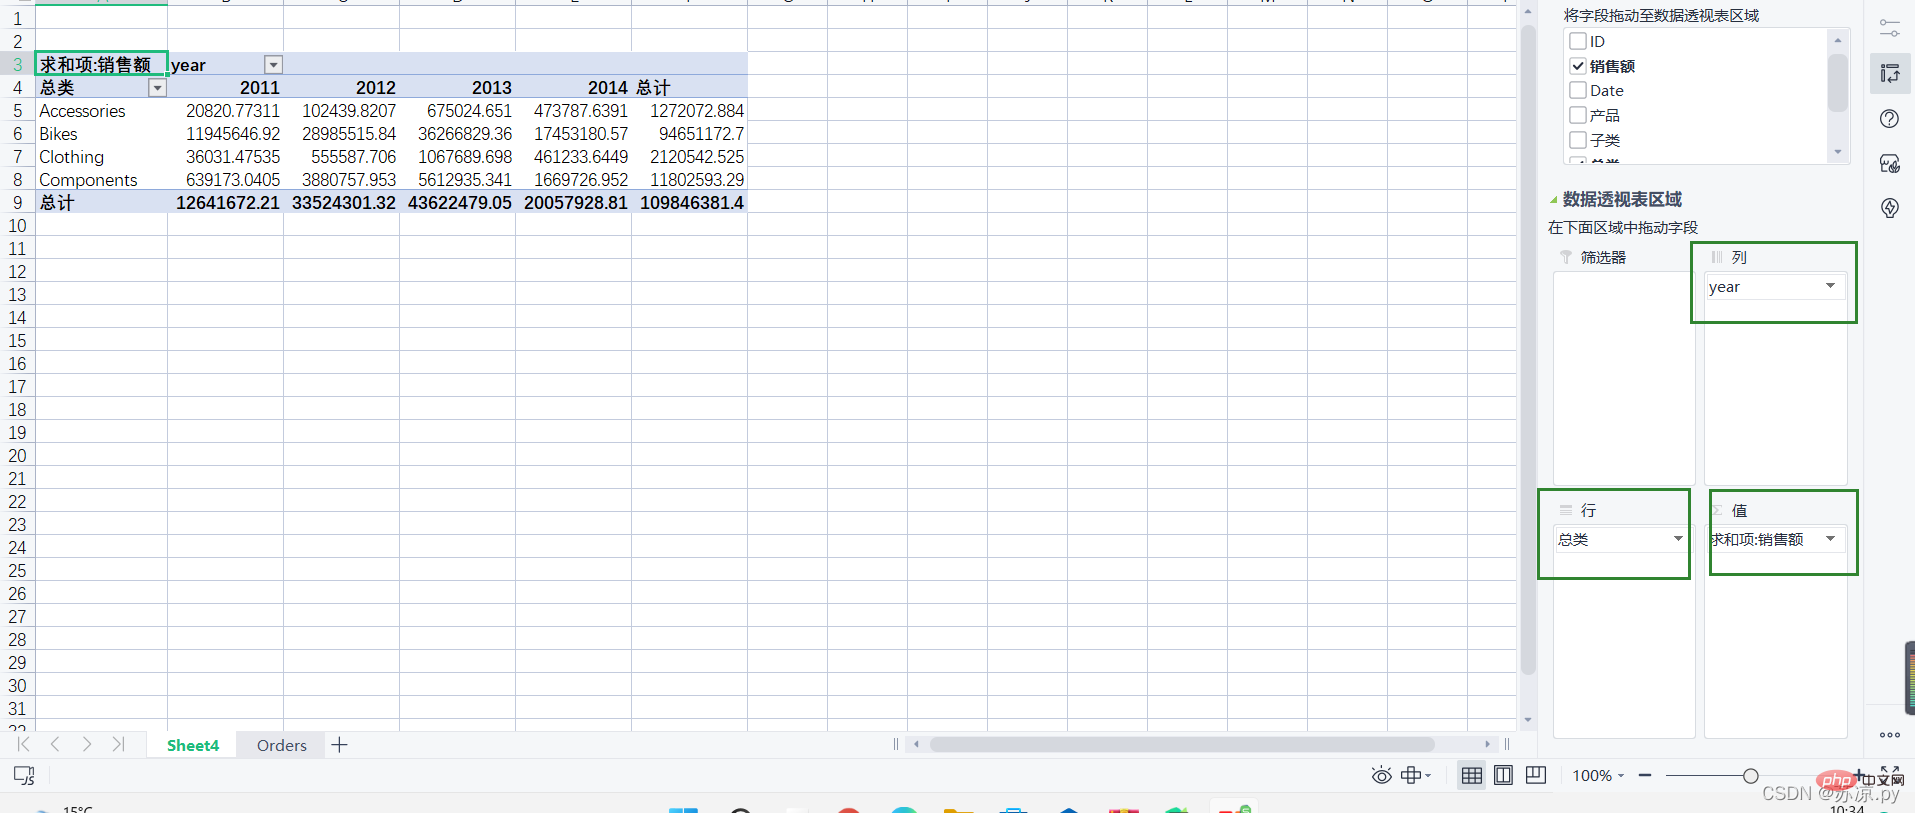
Then drag each part of the data to each area.
Result: 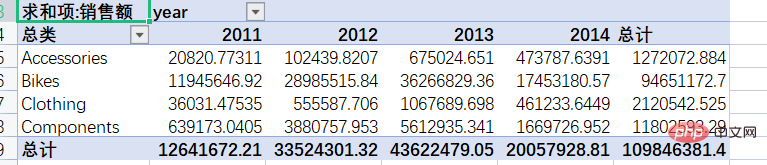
This completes the creation of the pivot table in excel.
So how to achieve this effect in pandas?
The function for drawing a pivot table is: df.pivot_lable(index, columns, values), and finally sum the data.
import pandas as pd
import numpy as np
pd.options.display.max_columns =999
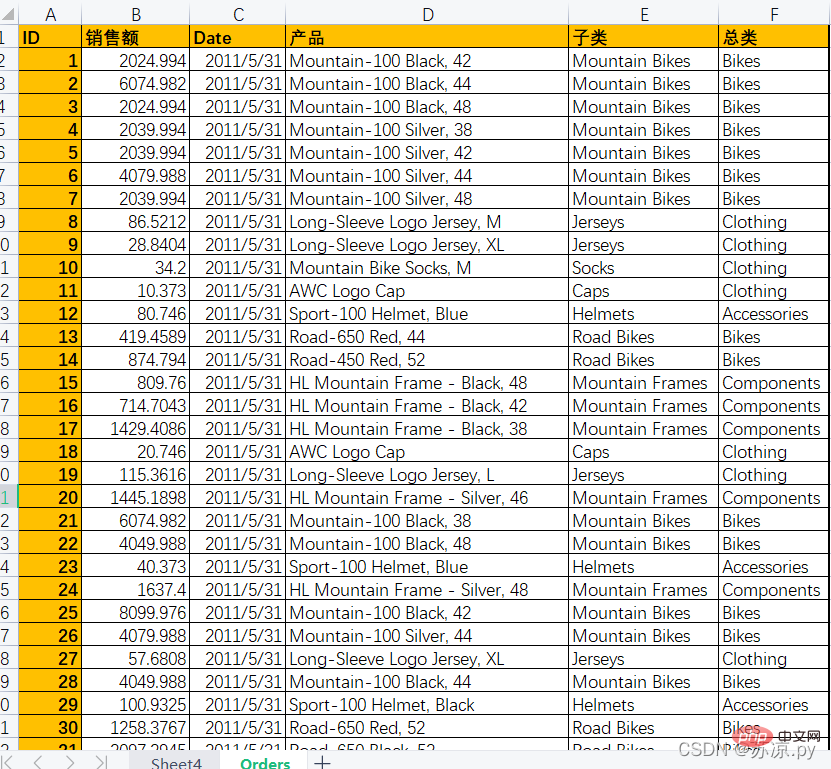
test = pd.read_excel('./excel/test14.xlsx')
df = pd.DataFrame(test)
# 将年份取出并新建一个列名为年份的列
df['year'] = pd.DatetimeIndex(df['Date']).year
# 绘制透视表
table = df.pivot_table(index='总类',columns='year',values='销售额',aggfunc=np.sum)
df1 = pd.DataFrame(table)
df1['总计'] = df1[[2011,2012,2013,2014]].sum(axis=1)
print(df1)Result: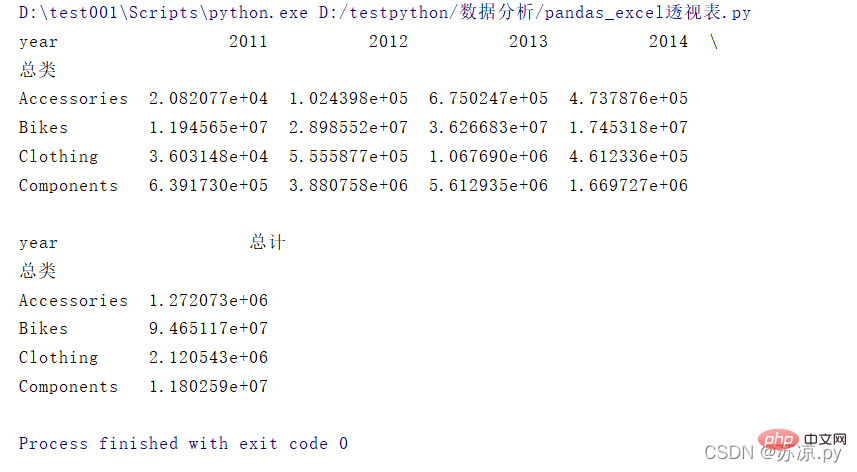
In addition, you can also use the groupby function to draw the data table. Here, the total category and year are grouped to calculate the total sales and sales quantity.
import pandas as pd
import numpy as np

pd.options.display.max_columns =999
test = pd.read_excel('./excel/test14.xlsx')
df = pd.DataFrame(test)
# 将年份取出并新建一个列名为年份的列
df['year'] = pd.DatetimeIndex(df['Date']).year

# groupby方法
group = df.groupby(['总类','year'])

s= group['销售额'].sum()
c = group['ID'].count()

table = pd.DataFrame({'sum':s,'total':c})

print(table) Result: 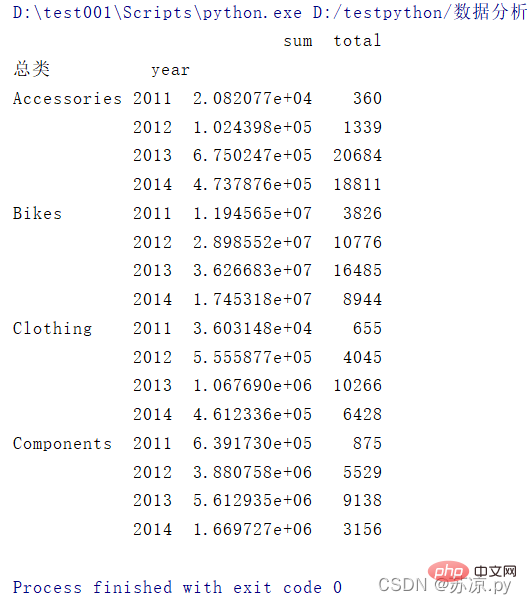
Recommended learning: python video tutorial
The above is the detailed content of Python data analysis: pandas handles Excel tables. For more information, please follow other related articles on the PHP Chinese website!


![[Web front-end] Node.js quick start](https://img.php.cn/upload/course/000/000/067/662b5d34ba7c0227.png)


