This article brings you relevant knowledge aboutexcel. It mainly introduces related issues about folding tables, which is the function of classification and summary. It will be very convenient to view the data in this way. The following is Let's take a look, hope it helps everyone.

Related learning recommendations:excel tutorial
Let’s first look at the display effect of a table.
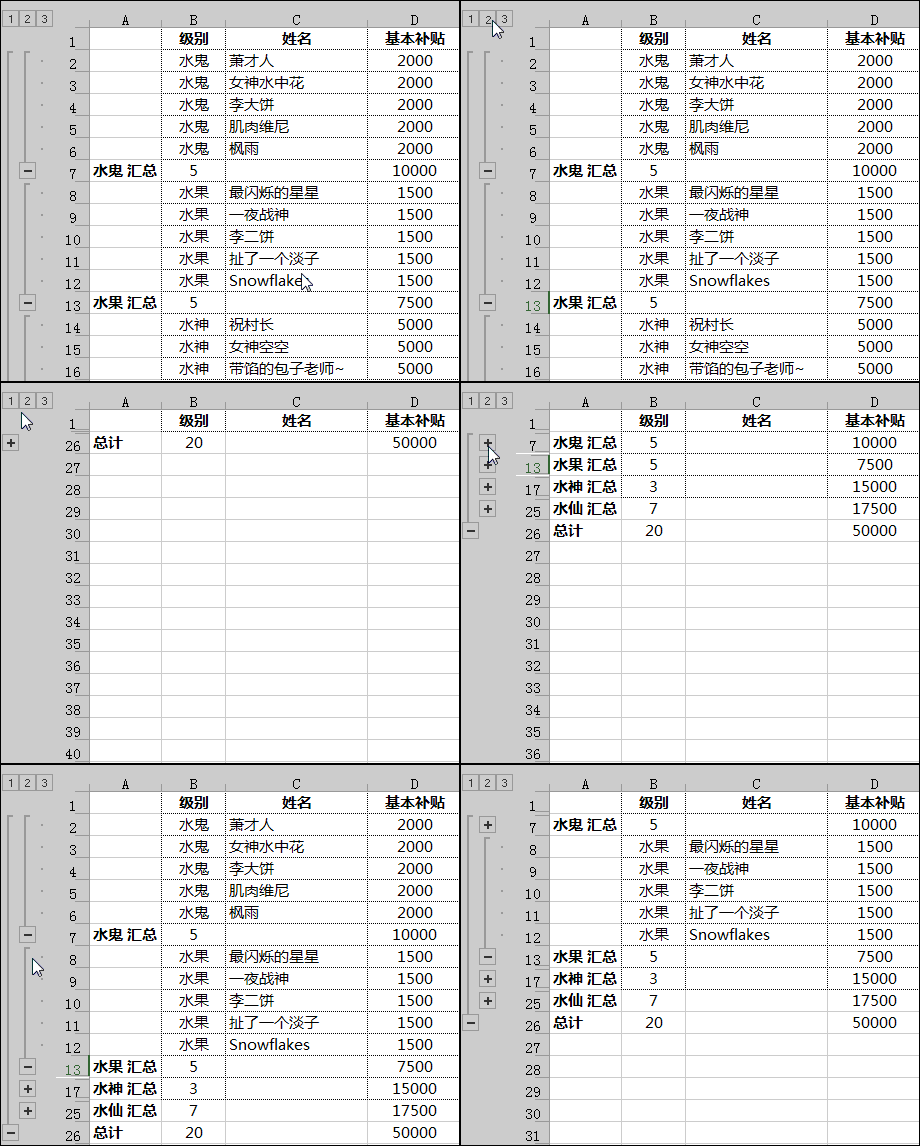
# Isn’t it very convenient to view data like this? It’s cool and convenient.
There are many friends who definitely don’t know how to set this up. In fact, this is the well-known classification and summary function. Let’s learn about it today.
In daily work, it is often necessary to quickly classify data and summarize projects in a certain way.
The classification and summary function can help us achieve such requirements.
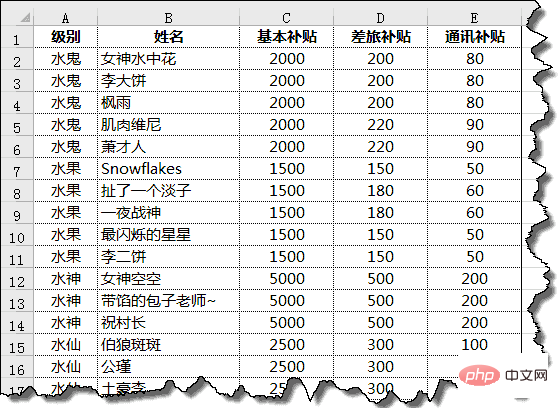
For example, the following data:
Such a data source is very regular, and our requirement is just to summarize this data according to levels. The number of people at the level, and the subsidy items must also be summed.
Friends who know something about classification and aggregation may be impatient:
Select all data areas, click [Data] [Classification and Summary]~
STOP!
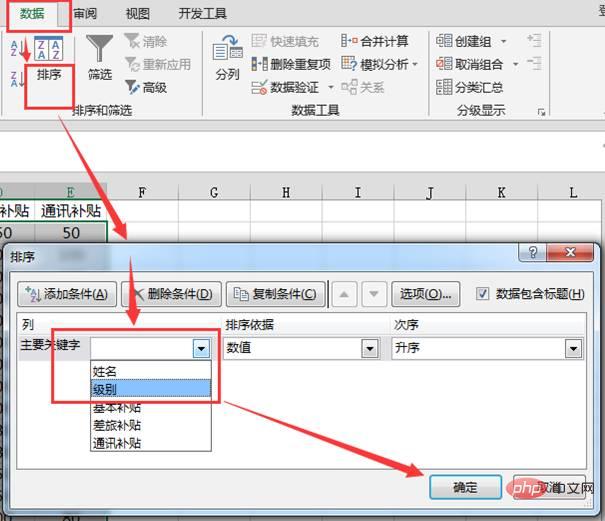
Don’t worry, don’t worry, the most important step of classification and aggregation [sorting] has not been done yet.
Yes, it is sorting. If the reference level of classification is not sorted, the consequences of direct classification and aggregation will be messed up:
Such a result is obviously not Meet the requirements in daily work. ~
First, sort the reference columns [levels] that need to be summarized. After sorting, content of the same category will be gathered together.
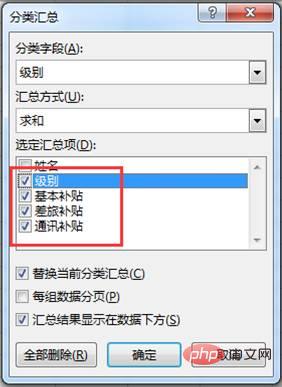
Then we can classify and summarize them, and that’s it.
Note that [Level] is checked here, the purpose is to calculate the number of people at each level~
Click the [OK] button to complete the preliminary process .
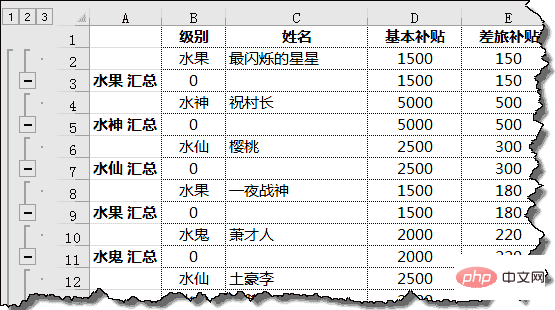
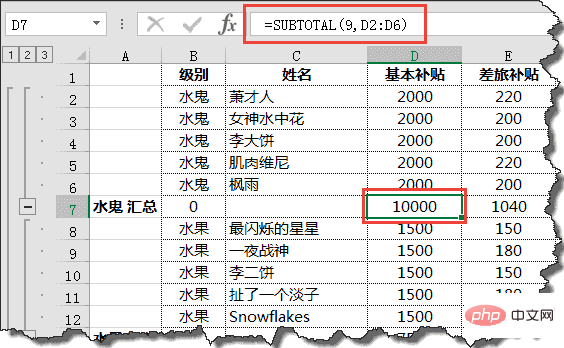
Click on the summary cell, which contains the automatically generated summary formula.
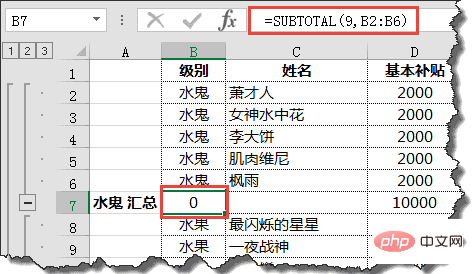
The subsidy and other contents of each level have been summed and summarized, but we see that the count of each level in column B still shows 0.
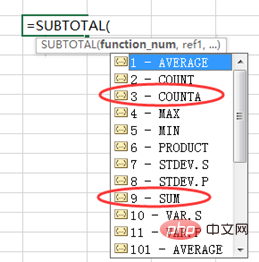
Here are some additional explanations about the SUBTOTAL function. It’s up to the officers to figure out more.
I believe that at this time, some readers already know that if the first parameter of SUBTOTAL is 3, it is counting. If the first parameter is 9, it is summation calculation.
How to batch modify the formula for calculating the number of levels to count? You can do this~
Select column B where [Level] is located, press Ctrl H to bring up the replacement dialog box.
Click the plus sign or minus sign on the left or the number in the upper left corner to display it hierarchically.
Related learning recommendations:excel tutorial
The above is the detailed content of One article teaches you the folding table classification and summary function of Excel. For more information, please follow other related articles on the PHP Chinese website!
 Compare the similarities and differences between two columns of data in excel
 excel duplicate item filter color
 How to copy an Excel table to make it the same size as the original
 Excel table slash divided into two
 Excel diagonal header is divided into two
 Absolute reference input method
 java export excel
 Excel input value is illegal


