
Free learning recommendation: python video tutorial
matplotlib has powerful drawing functions, But the sentences are trivial, and it would be too troublesome to write them sentence by sentence every time they are used. This article summarizes common drawing functions based on daily drawing experience, which can be used directly and is very convenient
import matplotlib.pyplot as pltimport pandas as pdimport numpy as np
plt.rcParams['font.sans-serif']=['simhei']#用于正常显示中文标签plt.rcParams['axes.unicode_minus']=False#用于正常显示负号
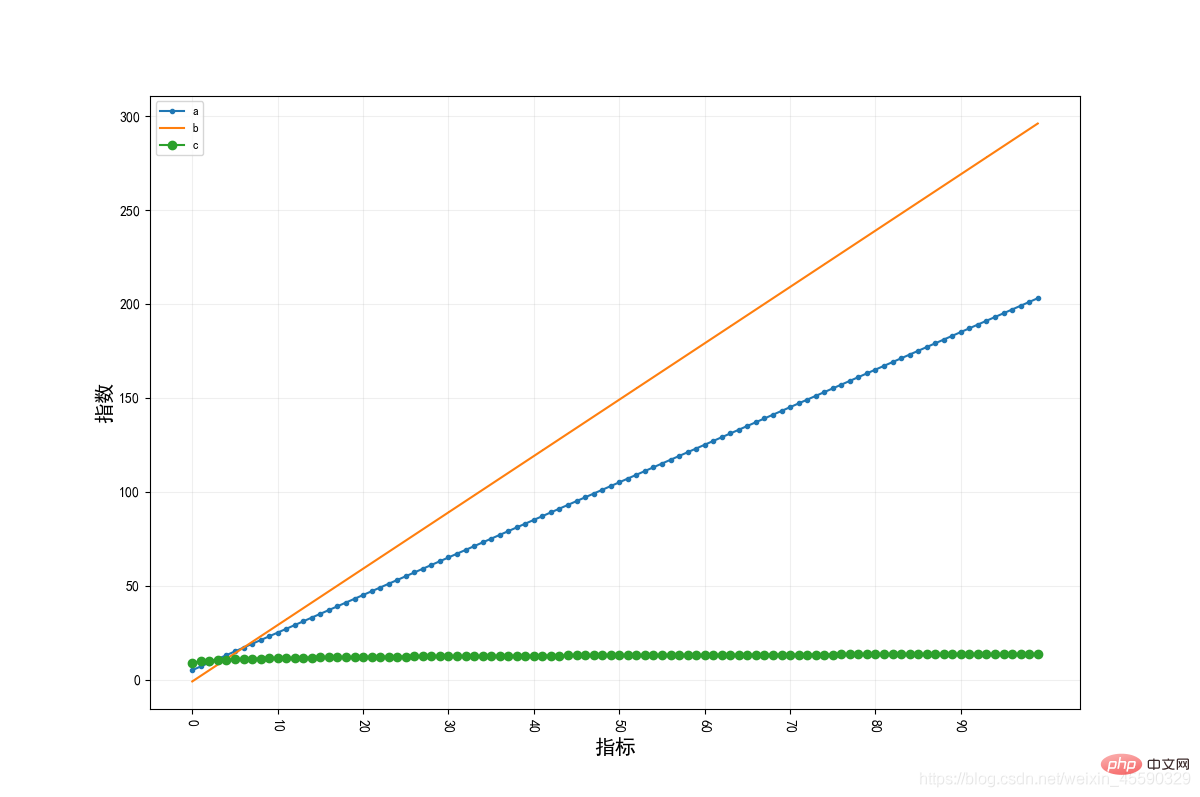
1. Draw using DataFrame tables containing multiple columns of data
def plot_cols(data,xlabel=None,ylabel=None,path_file=None,marker=True,len_xticks=10,save=False):
    """
    :param data:DataFrame,数据表格--行标题为横坐标,列标题为数据列
                Series,序列——行标题为横坐标,name为数据列
    :param xlabel: str,横坐标名称
    :param ylabel: str,纵坐标名称
    :param path_file: str,保存文件路径
    :param marker: bool,是否为每条线添加不同的标记
    :param len_xticks:int,横坐标显示的值个数
    :param save: bool,是否保存图片
    example:
        data=pd.DataFrame(np.random.random((100,3)),index=np.arange(100),columns=['a','b','c'])
        plot_cols(data,xlabel='指标',ylabel='指数')
    """
    data.index=data.index.astype(str)
    plt.figure(figsize=(12,8))
    markers=['.',',','o','v','^','','1','2','3','4','s','p','*','h','H','+','x','D','d','|','_']#标记符号

    #如果是DataFrame表格形式,则画出多列;如果是Series,则画出单列
    if type(data) is pd.core.frame.DataFrame:
        #是否为每条线添加不同的符号
        if marker==False:
            for col in data.columns:
                plt.plot(data[col],marker='o',label=col)
        else:
            for col,marker_ in zip(data.columns,markers):
                plt.plot(data[col], marker=marker_, label=col)

    elif type(data) is pd.core.series.Series:
        plt.plot(data, marker='o', label=data.name)

    plt.legend(loc='best',fontsize='small')
    xticks=np.linspace(0,len(data),(len_xticks+1)).astype(int).tolist()[:-1]#被显示的横坐标刻度值的位置
    plt.xticks(data.index[xticks],rotation=270)
    plt.ylabel(ylabel,fontsize=15)
    plt.xlabel(xlabel,fontsize=15)
    plt.grid(True,alpha=0.2)
    if save==True:plt.savefig(path_file)if __name__=='__main__':
    x=np.arange(1,101)
    data = pd.DataFrame({'a':x*2+3,'b':x*3-4,'c':np.log(x)+9}, index=np.arange(100))
    plot_cols(data, xlabel='指标', ylabel='指数')
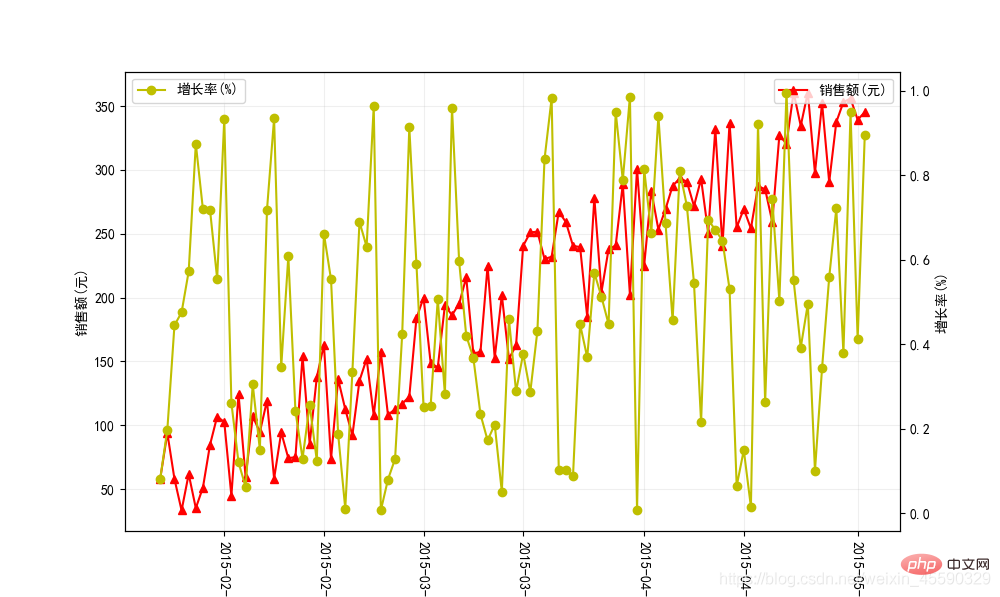
2. Convert the DataFrame table data containing two columns into a dual-axis chart
def plot_twins(data,col1,col2,xlabel=None,ylabel1=None,ylabel2=None,len_xticks=10,figsize=(10,6),save_path=None):
    """将含有两列的DataFrame表格数据作为双轴图
    :param data: DataFrame,含有两列的DataFrame表格数据
    :param col1: str,左图列标题
    :param col2: str,右图列标题
    :param xlabel: str,横轴标题
    :param ylabel1: str,左y轴标题
    :param ylabel2: str,右y轴标题
    :param len_xticks: int,显示的刻度个数
    :param figsize: turple,图大小
    :param save_path: str,图片保存路径。默认为None,不保存图片
    :return:
    example:
        x=np.arange(0,100)
        data=pd.DataFrame({'销售额(元)':3*x+np.random.random(100)*100,'增长率(%)':np.random.random(100)},index=pd.date_range('2015-01-23',periods=100,freq='D'))
        plot_twins(data,col1='销售额(元)',col2='增长率(%)',xlabel=None,ylabel1='销售额(元)',ylabel2='增长率(%)')
    """
    fig=plt.figure(figsize=figsize)#创建一块总画布
    # 将画板分为四行四列共16个单元格,(0, 0)表示从第一行第一列即第一个单元格开始画图,将第一行的三个单元格作为一个画块作画
    ax=plt.subplot2grid((1,1),(0,0),rowspan=1,colspan=1)

    plt.plot(data[col1],label=col1,color='r',marker='^')
    ax.legend(loc='upper right')#用于显示画布ax的图,切记用 loc= 表示位置
    ax.set_ylabel(ylabel1)
    xticks=np.linspace(0,len(data),(len_xticks+1)).astype(int).tolist()[:-1]#被显示的横坐标刻度值的位置
    ax.set_xticks(data.index[xticks])
    plt.xticks(rotation=270)

    twin=ax.twinx()
    plt.plot(data[col2],label=col2,color='y',marker='o')
    twin.legend(loc='upper left')
    twin.set_ylabel(ylabel2)
    ax.set_xlabel(xlabel)
    ax.grid(True,alpha=0.2)
    if save_path!=None: plt.savefig(save_path)if __name__=='__main__':
        x=np.arange(0,100)
        data=pd.DataFrame({'销售额(元)':3*x+np.random.random(100)*100,'增长率(%)':np.random.random(100)},index=pd.date_range('2015-01-23',periods=100,freq='D'))
        plot_twins(data,col1='销售额(元)',col2='增长率(%)',xlabel=None,ylabel1='销售额(元)',ylabel2='增长率(%)')
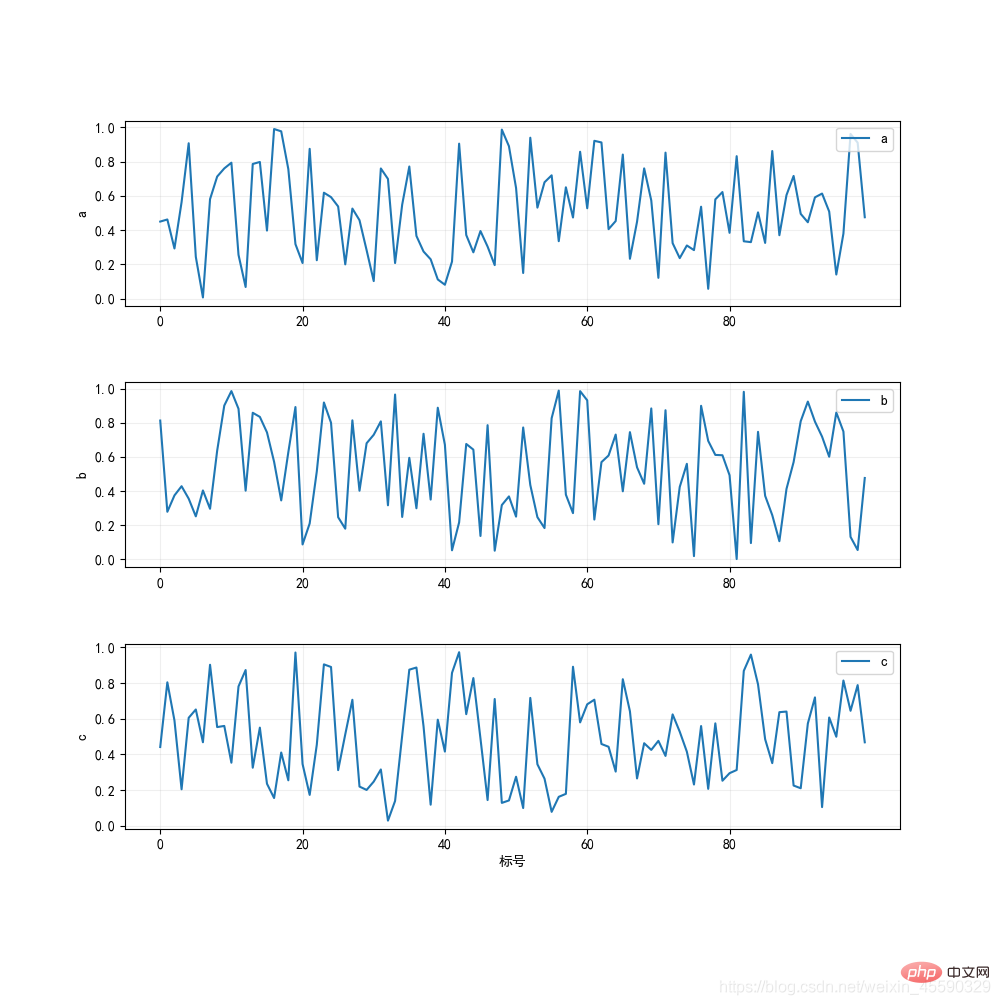
3. Convert the DataFrame Multiple columns of data in the table are drawn into multiple graphs
def plot_figs(data,xlabel=None,ylabels=None,save_path=None,len_xticks=5,length=10,width=3,intervals=1):
    """
    将DataFrame表格中的多列数据绘制成多个图
    :param data:DataFrame,含有多列的表格
    :param xlabel:str,横轴标题
    :param ylabels:list,各个图的纵轴标题
    :param path_save:str,图片保存路径。默认为None,不保存图片
    :param len_xticks: int,显示的刻度个数
    :param length:int,画板长度
    :param width:int,图画宽度
    :param intervals:int,图画之间间隔距离
    :return:
    example:
        data=pd.DataFrame(np.random.random((100,3)),index=np.arange(100),columns=['a','b','c'])
        plot_figs(data,xlabel='标号',ylabels=['a','b','c'])
    """

    cols=data.columns
    num_fig = len(data.columns)
    fig = plt.figure(figsize=(length, 4*num_fig))  # 创建一块总画布
    for i in range(0,num_fig):
        #i=2

        ax = plt.subplot2grid((num_fig*(width+intervals), 1), (i*(width+intervals), 0), rowspan=width,
                               colspan=1)  # 将画板分为四行四列共16个单元格,(0, 0)表示从第一行第一列即第一个单元格开始画图,将第一行的三个单元格作为一个画块作画

        ax.plot(data[cols[i]], label=cols[i])
        ax.legend(loc='upper right')  # 用于显示画布ax1的图,切记用 loc= 表示位置
        if ylabels!=None:ax.set_ylabel(ylabels[i])
        if xlabels!=None and i==(num_fig-1):ax.set_xlabel(xlabel)
        xticks = np.linspace(0, len(data), (len_xticks + 1)).astype(int).tolist()[:-1]  # 被显示的横坐标刻度值的位置
        ax.set_xticks(data.index[xticks])
        plt.grid(True,alpha=0.2)
    if save_path != None: plt.savefig(save_path)if __name__=='__main__':
    data=pd.DataFrame(np.random.random((100,3)),index=np.arange(100),columns=['a','b','c'])
    plot_figs(data,xlabel='标号',ylabels=['a','b','c'])

##Related free learning recommendations: python tutorial(video)
The above is the detailed content of Introducing the common drawing functions of python's matplotlib. For more information, please follow other related articles on the PHP Chinese website!