

Related learning recommendations: python tutorial
Python is open source, it is great, but open source cannot be avoided. Some inherent problems: Many packages do (or try to do) the same thing. If you're new to Python, it's hard to know which package is the best for a specific task. You need someone with experience to tell you. There is one package for data science that is an absolute must-have, and it is pandas.
The most interesting thing about pandas is that there are many packages hidden inside. It is a core package with many features from other packages. This is great because you can just use pandas and get the job done.
pandas is equivalent to excel in python: it uses tables (that is, dataframes) and can perform various transformations on data, but it also has many other functions.
If you are already familiar with the use of python, you can jump directly to the third paragraph.
Let's get started:
import pandas as pd复制代码
Don't ask why "pd" instead of "p", that's it. Just use it:)
Read data
data = pd.read_csv( my_file.csv )
data = pd.read_csv( my_file.csv , sep= ; , encoding= latin-1 , nrows=1000, skiprows=[2,5])复制代码
sep represents the separator. If you are using French data, the csv delimiter in excel is ";", so you need to specify it explicitly. The encoding is set to latin-1 to read French characters. nrows=1000 means reading the first 1000 rows of data. skiprows=[2,5] means that you will remove lines 2 and 5 when reading the file.
Most commonly used functions: read_csv, read_excel
Some other great functions: read_clipboard, read_sql
Write data
data.to_csv( my_new_file.csv , index=None)复制代码
index=None means the data will be written as it is. If you do not write index=None, you will have an extra first column with contents 1, 2, 3,..., until the last row.
I usually don’t use other functions, like .to_excel, .to_json, .to_pickle, etc., because .to_csv can do the job well, and csv is the most commonly used way to save tables.
Check the data

Gives (#rows, #columns)复制代码
data.describe()复制代码
View data
data.head(3)复制代码
data.loc[8]复制代码
data.loc[8, column_1 ]复制代码
data.loc[range(4,6)]复制代码
Logical operations
data[data[ column_1 ]== french ]
data[(data[ column_1 ]== french ) & (data[ year_born ]==1990)]
data[(data[ column_1 ]== french ) & (data[ year_born ]==1990) & ~(data[ city ]== London )]复制代码
data[data[ column_1 ].isin([ french , english ])]复制代码
Basic Plotting
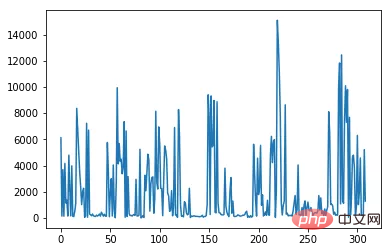
The matplotlib package makes this functionality possible. As we said in the introduction, it can be used directly in pandas.data[ column_numerical ].plot()复制代码
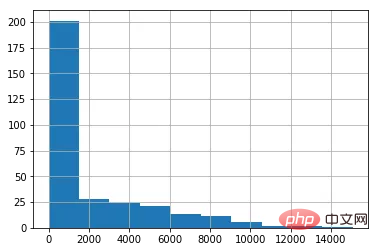
data[ column_numerical ].hist()复制代码
%matplotlib inline复制代码
Update data
data.loc[8,  column_1 ] =  english
将第八行名为 column_1 的列替换为「english」复制代码
data.loc[data[ column_1 ]== french , column_1 ] = French复制代码
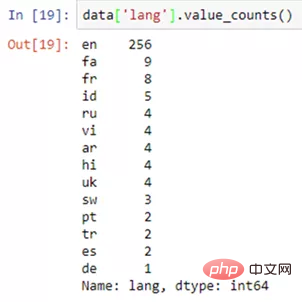
data[ column_1 ].value_counts()复制代码
data[ column_1 ].map(len)复制代码
.map() operation applies a function to each element in a column
data[ column_1 ].map(len).map(lambda x: x/100).plot()复制代码
A great feature of pandas is the chain method (tomaugspurger.github.io/method-chai… and .plot( )).
data.apply(sum)复制代码
.apply() will apply a function to a column.
.applymap() will apply a function to all cells in the table (DataFrame).
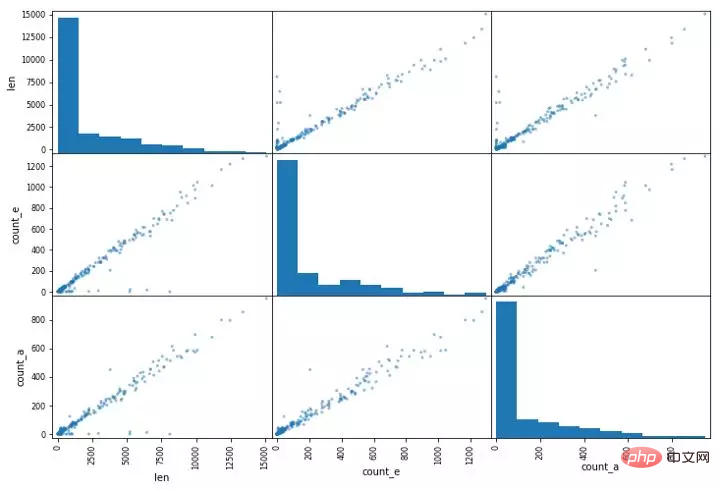
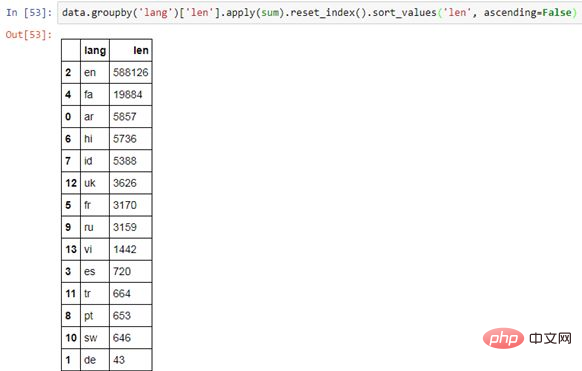
tqdm, the only one在处理大规模数据集时,pandas 会花费一些时间来进行.map()、.apply()、.applymap() 等操作。tqdm 是一个可以用来帮助预测这些操作的执行何时完成的包(是的,我说谎了,我之前说我们只会使用到 pandas)。 用 pandas 设置 tqdm 用 .progress_map() 代替.map()、.apply() 和.applymap() 也是类似的。 在 Jupyter 中使用 tqdm 和 pandas 得到的进度条 相关性和散射矩阵 .corr() 会给出相关性矩阵 散点矩阵的例子。它在同一幅图中画出了两列的所有组合。 The SQL 关联 在 pandas 中实现关联是非常非常简单的 关联三列只需要一行代码 分组 一开始并不是那么简单,你首先需要掌握语法,然后你会发现你一直在使用这个功能。 按一个列分组,选择另一个列来执行一个函数。.reset_index() 会将数据重构成一个表。 正如前面解释过的,为了优化代码,在一行中将你的函数连接起来。 行迭代 .iterrows() 使用两个变量一起循环:行索引和行的数据 (上面的 i 和 row) 总而言之,pandas 是 python 成为出色的编程语言的原因之一 我本可以展示更多有趣的 pandas 功能,但是已经写出来的这些足以让人理解为何数据科学家离不开 pandas。总结一下,pandas 有以下优点: 易用,将所有复杂、抽象的计算都隐藏在背后了; 直观; 快速,即使不是最快的也是非常快的。 它有助于数据科学家快速读取和理解数据,提高其工作效率 The above is the detailed content of The most detailed tutorial on Pandas. For more information, please follow other related articles on the PHP Chinese website!from tqdm import tqdm_notebook
tqdm_notebook().pandas()复制代码
data[ column_1 ].progress_map(lambda x: x.count( e ))复制代码

data.corr()
data.corr().applymap(lambda x: int(x*100)/100)复制代码

pd.plotting.scatter_matrix(data, figsize=(12,8))复制代码
pandas 中的高级操作
data.merge(other_data, on=[ column_1 , column_2 , column_3 ])复制代码
data.groupby( column_1 )[ column_2 ].apply(sum).reset_index()复制代码
dictionary = {}

for i,row in data.iterrows():
 dictionary[row[ column_1 ]] = row[ column_2 ]复制代码